Quantcast
Channel: Recent Discussions — DataTables forums
Viewing all 79570 articles
Browse latest View live

Datatables with JSON of objects and array

$
0
0

Hello, greetings to all.
I am very new to datatables and how to represent a JSON, so I resort to the experience of those who know.

I have a server that returns data in JSON and I want to show them in a table with these columns:

<td>Time</td>
<td>hostname</td>
<td>cpu</td>
<td>mem</td>
<td>load</td>
<td>disk</td>

So I call the JSON response:

$(document).ready(function() {
var table = $('#example').DataTable( {
"ajax": {
"url": "http://les000/query?db=tele&q=SELECT LAST(cpu_used) AS cpu, LAST(mem_used) AS mem, LAST(load) AS load, LAST(disk_await) AS disk_await FROM custom GROUP BY hostname ORDER BY time",
"dataType": "json",
"cache": false,
"contentType": "application/json; charset=utf-8"
deferRender: true,
columns: [
{data: 'time' },
{ data: 'hostname' },
{ data: 'cpu' },
{ data: 'mem' },
{ data: 'load' },
{ data: 'disk' }
],
rowId: 'extn',
select: true,
dom: 'Bfrtip',
buttons: [
{
text: 'Reload table',
action: function () {
table.ajax.reload();
}
}
]
} );
} );

I get the following answer:

Método de la petición: GET
Código de estado: HTTP/1.1 200 OK

And this the JSON that I get:

{
"results": [{
"statement_id": 0,
"series": [{
"name": "custom",
"tags": {
"hostname": "LINUX2345"
},
"columns": ["time", "cpu", "mem", "load", "disk_await"],
"values": [
["1970-01-01T00:00:00Z", 1, 78, 0, 0]
]
}, {
"name": "custom",
"tags": {
"hostname": "LINUX344334"
},
"columns": ["time", "cpu", "mem", "load", "disk_await"],
"values": [
["1970-01-01T00:00:00Z", 9, 49, 1, 0]
]
}]
}]
}

But in the table I have nothing.

Can someone please guide me? Thank you.


Coldfusion handling of datatables “sent parameters”

$
0
0

Anyone had any success in using the "serverSide" mode in ColdFusion, particularly in getting ColdFusion to properly parse the parameters sent by datatables into complex variables? For example, currently CF simply chuck all the parameters into a flat form "struct" variable, with struct keys like "columns[1][data]" or "search[value]". How do I get CF to parse these parameters into complex variables like form.columns[1].data or form.search.value?

According to the documentation at https://datatables.net/manual/server-side, it says that "In most modern server-side scripting environments this data will automatically be available to you as an array.". Is CF simply too out-of-date? I'm using CF11.

Issue with Bootstrap Navbar Toggle and Data Tables

$
0
0

I have an issue with the collapsible navbar made with bootstrap. When I reference the Data Tables CDN links in my head, my menu will NOT collapse after opening it in a mobile window. It flickers really fast to closed and then re-opens. Basically I can't close it. If I remove the DataTables cdn references then everything works fine.

Here is my navbar code:

 <div class="navbar navbar-default navbar-static-top">
      <div class="container">
        <div class="navbar-header navbar-left">
            <center>
                <button type="button" class="navbar-toggle navbar-text" data-toggle="collapse" data-target=".navbar-collapsev">
                    <span class="icon-bar"></span>
                    <span class="icon-bar"></span>
                    <span class="icon-bar"></span>
                </button>
            </center>
        </div>
        <nav class="navbar-collapse collapse">

//etc.....

here are my CDN links:

<!-- DataTables -->
<link rel="stylesheet" type="text/css" href="https://cdn.datatables.net/t/bs-3.3.6/jq-2.2.0,dt-1.10.11,cr-1.3.1,r-2.0.2/datatables.min.css" />

<script type="text/javascript" src="https://cdn.datatables.net/t/bs-3.3.6/jq-2.2.0,dt-1.10.11,cr-1.3.1,r-2.0.2/datatables.min.js"></script>

Exclude from datatable but in search

$
0
0

Is it possible to tell DataTables to not show certain columns but have to search?
Example, I don't want to Show City column but I could search Cities.

Many thanks for your help

sorting images

$
0
0

I am not having access to github site. I needs images to download 'sort_asc.png,sort_desc.png,sort_both.png' . Please help me.

pagination

$
0
0

Hi Guys
im stuck on this issue.
i have generated a datatable table dynamically, as the data is coming from mysql Table. everything works fine, that is the search box, the pagination. now the only thing that i need is to increase the pages from default 5 to 10 for example. i want to change from
previous 1 2 3 4 5 .....90 next
to
previous 1 2 3 4 5 6 7 8 9 10 .... 90 next

thank you in advance

datatables create filter checkbox

$
0
0

Hello,
I found this on another site. With this example that perfectly corresponds to what I want to do.
Except that it works with 1 choice but no more and I would like to be able to check more checkboxes.

It's a little complex for my level, if someone could help me. I am a big user of datable but the.... I dry up in understanding
Thank you.

http://jsfiddle.net/vol7ron/z7wJ5/

Inline Editor select/select2 update problem in client side

$
0
0

In Editor client side Inline editor mode, I use select2 to fetch the data to update the field named 'good_id',like this

Datatable Columne
{
       title: name'',
       data: 'good_name',
       editField: 'good_id',
       defaultContent: 'please select good'
 }
Editor Field
{
                label: 'name:',
                name: 'good_id',
                type: 'select2',
                optionsPair: {
                    label: 'text',
                    value: 'id'
                },
                display: 'good.name',
                opts: {
                    allowClear: true,
                    dropdownAutoWidth:true,
                     delay:250,
                    ajax: {
                        url: goodUrl,
                        data: function (params) {
                            return {
                                search: params.term
                            }
                        },
                        processResults: function (data, params) {
                            return {
                                results :
                                    data.map(function(item) {
                                        return {
                                            id : item.id,
                                            text : item.name
                                        };
                                    }
                            )};
                        }
                    }
                }
            },

When I select a good, ' id : 1, text: 'aaa', I only can update the good_id field , but I want the good_name can be update as 'aaa', otherwise the td will display white because the good_name doesn't update , So please tell me how should I deal with this problem. All the editor event can only get the the id value not the text.


2 table droag and drop

$
0
0

Hi guys

Hope you are all well.

Hope you can help me with this again. Can i have 2 tables then from 1 table to another table drag and drop multiple selected records. Please help. thanks so much for always helping me.
Hope you all enjoy your christmas. be happy always.

Rowgroup fill color

$
0
0

Hi guys

Again need your help. How can i add color per row group. thanks so much for the help ☺

Filter the list in a combobox

$
0
0

Hi,
I want to filter the list in a combobox, from a datatable editor. When I use the where condition, I do not have any errors, but it does not return any records.

Editor::inst( $db, 'tb_diccionario' )
->field(
Field::inst( 'tb_diccionario.materia_id' )
->options( Options::inst()
->table( 'tb_materia' )
->value( 'id' )
->label( 'materia' )
->where( 'tb_materia.activo', 1 )
),
Field::inst( 'tb_materia.materia' ),

->leftJoin( 'tb_materia', 'tb_materia.id', '=', 'tb_diccionario.materia_id' )

*Activo es un campo de la tabla materia de tipo tinyint.

Fixed columns + ScrollY: bug with mousewheel button scroll

$
0
0

Hi there,

Though there have been several threads about rows not scrolling on standard mousewheel scroll, I haven't seen this one documented anywhere.

  1. Goto the basic demo of Fixed Columns:
    https://datatables.net/extensions/fixedcolumns/examples/initialisation/simple.html
  2. Mousewheel-click inside a non-fixed column and start scrolling down.
  3. Maintain mousewheel pressed, then drag over the fixed column.

Problem: the fixed column stops scrolling down! It snaps back in place only when we go back hovering a non-fixed column, or scroll the table vertically in another way (mousewheel or scrollbars).

Seen in the latest versions of Chrome and Firefox (Jan 7, 2019)
Not seen in Internet Explorer 11.

get data child row

$
0
0

hello every one. I have table with row child and how i can get only data clicked row child ? ?
Thanks in advance!

Recommendations please

$
0
0

I am asking what software is recommended for creating a website (that needs the minimum of coding experience) and to work easily with DataTables?

Any pointers appreciated.

How I can to do this?

$
0
0

Hello, I need to do a table with child rows (but not extra information) like the image . How I can to do?


JQuery/Popovers not working in responsive mode

$
0
0

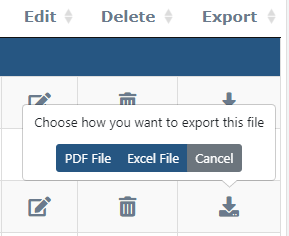
Hello, i have a large table with 3 buttons, 2 of the buttons work perfectly in both desktop and responsive mode, the last button which is the export button only works perfectly in desktop mode as shown:

when the user is in responsive mode, this button does not work, it still triggers other javascript events but does not trigger the popover/ bootstrap confirmation event.

The code for the button is shown here:

//this is the code for the button
 <a role="export" class="btn custom-confirmation" data-original-title="" title="" data-popout="true" data-singleton="true"   data-content="Choose how you want to export this file" data-toggle="confirmation" aria-label="Settings" onclick="excelExport('<?php echo $portal['workpackage']; ?>');">
                                <i class="fas fa-download icon-colour  fa-lg" aria-hidden="true" >
                                </i>
                              </a>

This is the code for the Datatable

// Datatable initialization code
 $(document).ready( function () {
      
      
      if (document.getElementById('myTable')) {
      
    $('#myTable').css('visibility','visible');
    var table = $('#myTable').DataTable(
      {
        responsive: true,
        columnDefs: [
          {
            targets: [0, 3, 4, 5, 7, 8, 9, 11, 12, 13], visible: true}
          ,
          {
            targets: '_all', visible: false }
          ,
          {
            targets: [5,8,9],
            render: $.fn.dataTable.render.moment( 'DD MMM YY' )
          }
          ,
          {
            width: "20%", targets: [4] }
        ],
        "order": [[ 10, "des" ]],
        "pageLength": 10,
        rowGroup: {
          enable: true,
          dataSrc: 1,
        }
        ,
        "dom": '<"toolbar">frtip',
        initComplete: function(){
          $("div.toolbar").html('<button type="button" style="margin:5px;" id="modalcreate"  class="btn btn-primary" data-toggle="modal" data-backdrop="static" data-target="#exampleModalCenter1" onclick="getUser();">Create EWN</button>');
        }
          
          
      }
    );
          
      }
      

And lastly this is the code for bootstrap-confirmation http://bootstrap-confirmation.js.org/

//bootstrap-confirmation.js code
$('.custom-confirmation').confirmation({
    rootSelector: '.custom-confirmation',
    container: 'body',
    title: '',
    
    buttons: [
      {
        class: 'btn btn-primary',
        label: 'PDF File',
        onClick: function() {
alert('Exporting as PDF File');
    
    },
        value: 'PDF'
      },
      {
        class: 'btn btn-primary',
        label: 'Excel File',
        onClick: function() {
alert('Exporting as Excel File');
            document.getElementById('submittask4').click();
    
    },
        value: 'Excel'
      },
      {
        class: 'btn btn-secondary',
        
        label: 'Cancel',
        cancel: true
      }
    ]
  });
            });

I want to be able to click the button while on mobile view and have the prompt appear as in the picture on the first click.
Thanks for any help

Display default select inputs properly

$
0
0

I have several columns in my datatable that use the select inputs dropdowns. I used searchcols to force three of those columns to choose a default value. This works in theory; however, even though that value is searched, the dropdown displays the blank (or 'all') option and doesn't actually select the intended value - it's just running a search in that column. This has multiple user problems. How can I make it so the intended value is selected by default? Additionally, can I select multiple inputs on page load, or will I need a plugin for that? Here's my code:

initComplete: function () {
                    this.api().columns([3,4,5,6,14,15,16,17]).every( function () {
                        var column = this;
                        var select = $('<select><option value=""></option></select>')
                            .appendTo( $(column.header()).empty() )
                            .on( 'change', function () {
                                var val = $.fn.dataTable.util.escapeRegex(
                                    $(this).val()
                                );

                                column
                                    .search( val ? ''+val+'$' : '', true, false )
                                    .draw();
                            } );

                        column.data().unique().sort().each( function ( d, j ) {
                            select.append( '<option value="'+d+'">'+d+'</option>' )
                        } );
                    } );
                },
                
                "searchCols": [
                    null,
                    null,
                    null,
                    null,
                    null,
                    null,
                    null,
                    null,
                    null,
                    null,
                    null,
                    null,
                    null,
                    null,
                    { "search": "N", "escapeRegex": false },
                    null,
                    { "search": "B", "escapeRegex": false },
                    { "search": "75", "escapeRegex": false },
                  ]

Call initComplete on table.ajax.reload()

$
0
0

Due to special layout on my webpage I need to get the "recordsTotal" value in a function when I do a table.ajax.reload()
When I do my initial datatable init I have an initCompletefunction where I can get the value in "settings._iRecordsTotal"

But initComplete is not called on ajax.reload. Is there any way to pass the "settings._iRecordsTotal" value when you do a ajax.reload?

I have tried to do a callback function but can 't get i to work: this.$datatable.DataTable().ajax.reload( function(){ this.totalHitsRender(); alert('COME ON') });
If I could only call my totalHItsRender() function like that....

How can I re-format the footerCallback

$
0
0
// COLUMN CALCULATUON FUNCTION   
             "footerCallback": function ( row, data, start, end, display ) {
                     var api = this.api(), data;

                 // Remove the formatting to get integer data for summation
                     var intVal = function ( i ) { return typeof i === 'string' ? i.replace(/[\$,]/g, '')*1 : typeof i === 'number' ?  i : 0;  };

                    // ENTER COLUMN NUMBER 
                    // Total over all pages
                     total = api     .column( 10 ) .data() .reduce( function (a, b) { return intVal(a) + intVal(b);  }, 0 );
                   
                    // Total over this page
                     pageTotal = api .column( 10, { page: 'current'} ) .data() .reduce( function (a, b) { return intVal(a) + intVal(b); }, 0 );
                   
                    // Update footer
                     $( api          .column( 10 ).footer() ).html( '$'+ total +''  );
                    // END 

                }, 

THE ABOVE RETURNS $1385.6399999999999

How can I re-format the intVal so it returns $1385.64

Row grouping with printing

$
0
0

I believe i solved the problem with printing with row grouping. I found a snippet of code on StackOverflow here and was able to fix it up to work with row grouping. This is placed in datatable-buttons.js on line 1564.

Heres some images of it working!
http://prntscr.com/fhx1vu
http://prntscr.com/fhx1ia

    var _exportData = function ( dt, inOpts )
    {

        var config = $.extend( true, {}, {
            rows:           null,
            columns:        '',
            grouped_array_index: [],
            modifier:       {
                search: 'applied',
                order:  'applied'
            },
            orthogonal:     'display',
            stripHtml:      true,
            stripNewlines:  true,
            decodeEntities: true,
            trim:           true,
            format:         {
                header: function ( d ) {
                    return strip( d );
                },
                footer: function ( d ) {
                    return strip( d );
                },
                body: function ( d ) {
                    return strip( d );
                }
            }

        }, inOpts );

        var strip = function ( str ) {
            if ( typeof str !== 'string' ) {
                return str;
            }

            // Always remove script tags
            str = str.replace( /<script\b[^<]*(?:(?!<\/script>)<[^<]*)*<\/script>/gi, '' );

            if ( config.stripHtml ) {
                str = str.replace( /<[^>]*>/g, '' );
            }

            if ( config.trim ) {
                str = str.replace( /^\s+|\s+$/g, '' );
            }

            if ( config.stripNewlines ) {
                str = str.replace( /\n/g, ' ' );
            }

            if ( config.decodeEntities ) {
                _exportTextarea.innerHTML = str;
                str = _exportTextarea.value;
            }

            return str;
        };


        var header = dt.columns( config.columns ).indexes().map( function (idx) {
            var el = dt.column( idx ).header();
            return config.format.header( el.innerHTML, idx, el );
        } ).toArray();

        var footer = dt.table().footer() ?
            dt.columns( config.columns ).indexes().map( function (idx) {
                var el = dt.column( idx ).footer();
                return config.format.footer( el ? el.innerHTML : '', idx, el );
            } ).toArray() :
            null;

        var rowIndexes = dt.rows( config.rows, config.modifier ).indexes().toArray();
        var selectedCells = dt.cells( rowIndexes, config.columns );
        var cells = selectedCells
            .render( config.orthogonal )
            .toArray();
        var cellNodes = selectedCells
            .nodes()
            .toArray();

        var grouped_array_index     = config.grouped_array_index;                     //customised
        var no_of_columns           = header.length;
        var no_of_rows              = no_of_columns > 0 ? cells.length / no_of_columns : 0;
        var body                    = new Array( no_of_rows );
        var body_data               = new Array( no_of_rows );                                //customised
        var body_with_nodes         = new Array( no_of_rows );                          //customised
        var body_with_nodes_static  = new Array( no_of_rows );                          //customised
        var cellCounter             = 0;

        for (var i = 0, ien = no_of_rows; i < ien; i++)
        {
            var rows            = new Array( no_of_columns );
            var rows_with_nodes = new Array( no_of_columns );

            for ( var j=0 ; j<no_of_columns ; j++ )
            {
                rows[j]             = config.format.body( cells[ cellCounter ], i, j, cellNodes[ cellCounter ] );
                rows_with_nodes[j]  = config.format.body( cellNodes[ cellCounter ], i, j, cells[ cellCounter ] ).outerHTML;
                cellCounter++;
            }

            body[i]                     = rows;
            body_data[i]                = rows;
            body_with_nodes[i]          = $.parseHTML('<tr class="even">'+rows_with_nodes.join("")+'</tr>');
            body_with_nodes_static[i]   = $.parseHTML('<tr class="even">'+rows_with_nodes.join("")+'</tr>');
        }

        /******************************************** GROUP DATA *****************************************************/
        var row_array                       = dt.rows().nodes();
        var row_data_array                  = dt.rows().data();
        var iColspan                        = no_of_columns;
        var sLastGroup                      = "";
        var inner_html                      = '',
            grouped_index;
        var individual_group_array          = [],
            sub_group_array                 = [],
            total_group_array               = [];
        var no_of_splices                   = 0;  //to keep track of no of element insertion into the array as index changes after splicing one element

        for (var i = 0, row_length = body_with_nodes.length; i < row_length; i++)
        {
            sub_group_array[i]              = [];
            individual_group_array[i]       = [];

            var sGroup                      = '';

            for(var k = 0; k < grouped_array_index.length; k++)
            {
                sGroup                          = row_data_array[i][grouped_array_index[k]];
                inner_html                      = row_data_array[i][grouped_array_index[k]];
                grouped_index                   = k;
                individual_group_array[i][k]    = row_data_array[i][grouped_array_index[k]];
                sub_group_array[i][k]           = sGroup;
            }

            total_group_array[i] = sGroup;


            console.log("grouped_index",grouped_index);

            if ( sGroup !== sLastGroup )
            {
                var table_data              = [];
                var table_data_with_node    = '';

                for(var $column_index = 0;$column_index < iColspan;$column_index++)
                {
                    if($column_index === 0)
                    {
                        table_data_with_node        += '<td style="border-left:none;border-right:none">'+inner_html+'</td>';
                        table_data[$column_index]   = inner_html + " ";
                    }
                    else
                    {
                        table_data_with_node        += '<td style="border-left:none;border-right:none"></td>';
                        table_data[$column_index]   = '';
                    }
                }

                body_with_nodes.splice(i + no_of_splices, 0, $.parseHTML('<tr class="group group_'+grouped_index+' grouped-array-index_'+grouped_array_index[grouped_index]+'">'+table_data_with_node+'</tr>'));
                body_data.splice(i + no_of_splices, 0, table_data);
                no_of_splices++;
                sLastGroup = sGroup;
            }
        }

        return {
            header: header,
            footer: footer,
            body:   body_data
        };
    };

Usage:
Define grouped_array_index in exportOptions

 exportOptions: {
        // Any other settings used
        grouped_array_index: [<place row to use here>],
 },
Viewing all 79570 articles
Browse latest View live


Latest Images