Quantcast
Channel: Recent Discussions — DataTables forums
Viewing all 82207 articles
Browse latest View live

Multi Select Search on colums (server_side-on)

$
0
0

Hello!
I've searched the net about it, but only old stuff for old versions.

I'm looking to do multi searches\filters on each column.
I prefer some kind of Multi-Select for a column.

I saw old examples that convert it to 'OR' expression, is there a better way\solution?

Also is it supported when I use server_side option?
I'm working with A lot of querys - about ~250K

Thanks AAAA Lot,
David.


drawCallback drawing on top of existing rows

$
0
0

Hi everyone,

I am encountering a bug for drawcallback. It draws a sum row as expected on most of the entries, however, sometimes it seems to draw over the regular rows. My data is consistent all around and most entries look great, it's only some entries liek this that seem to look strange.

My function is as follows:

 if (last !== affId_offId) {
                        $(rows).eq(i).before(
                            '<tr class="group" style="border: 1px solid #777"><td colspan="1" style="background-color:#BEBEBE"><button class="showDetails" id="button-' + affId_offId + '">&#9658;</button></td><td colspan="1" style="background-color:#BEBEBE">' + startDateSelect.slice(5) + ' to ' + endDateSelect.slice(5) + '</td><td colspan="1" style="background-color:#BEBEBE">' + affId_offId + '</td><td colspan="1" style="background-color:#BEBEBE">' + summary[affId_offId].cost + '</td><td colspan="1" style="background-color:#BEBEBE">' + summary[affId_offId].revenue + '</td><td colspan="1" style="background-color:#BEBEBE">' + summary[affId_offId].profit + '</td><td colspan="1" style="background-color:#BEBEBE" class="profitMarginSummary">' + summary[affId_offId].profitMargin + '</td><td colspan="1" style="background-color:#BEBEBE">' + summary[affId_offId].cpc + '</td><td colspan="1" style="background-color:#BEBEBE">' + summary[affId_offId].rpc + '</td><td colspan="1" style="background-color:#BEBEBE">' + summary[affId_offId].rpa + '<td colspan="1" style="background-color:#BEBEBE">' + summary[affId_offId].name + '</td><td colspan="1" style="background-color:#BEBEBE">' + summary[affId_offId].offer + '</td><td colspan="1" style="background-color:#BEBEBE">' + summary[affId_offId].affiliate + '</td></tr>'
                        );

                        last = affId_offId; // other processes like the summing itself follow later
}

Server side - limited data set each Ajax call- better documentation required

$
0
0

I am using datatable for a commercial project and quite happy. I am struggling to implement server side where I want to limit returned data to (say) only 50 records at a time. The documentation touts this ability and yet the server side example uses only 57 records (datatables_demo table) and when you view xhr response all data is returned (all 57 records). Is there a better demo that shows an MySQL table being used with limit on records returned per Ajax request?

maximum call stack size exceeded datatable rowsGroup

$
0
0

I'm working with datatable rowsgroup. The seanrio is , when I click a button, I'm getting data through ajax and set it to datatable. There is no problem in first "click" on button, from the second click (without refreshing the page) , it shows an error "maximum call stack size exceeded" and data is not loading.

I have a code like this
rowsGroup: [ 'datetime:name' ].

If I comment this, then no problem. So the problem is with "rowsGroup" May I know any solution for this?

Simplify the code and error correction

$
0
0

I'm using spring boot and datatable rowsGroup. I'm getting response from ajax call and load into data table. Once I draw the table, I also need to use rowsGroup. So do I need to destroy the table before using rowsGroup? If I destroy the table also, its working fine, otherwise "Cannot reinitialise DataTable" error arisen. But when I try to get data from ajax over time, its showing error "maximum call stack size exceeded". When I remove rowsGroup, no error. Please give a solution. And help me to simplify the code too. My code is below

$.ajax({
    type : "GET",
    url : " ${getFullfeedback}",
    data : {'startDateValue' : startDateVal},
    contentType : "application/json; charset=utf-8",
    cache : false,
    success : function(data) {  

    var table=$('#datatable').DataTable()

    $('#datatable').dataTable().fnClearTable();

    for (var i = 0; i < data.length; i++) {
     $('#datatable').DataTable().row.add(
        [
            //few fields
            data[i].feedback
        ]).draw();
    }

    table.destroy()                 

    $('#datatable').DataTable({
        dom: 'Bfrtlip',
        buttons: [          
            {
                extend: 'copyHtml5',
                exportOptions: {
                    columns: [ 0, ':visible' ]
                }
            }, 
            'colvis' 
        ],  
        columns: [    
            {
                name: 'feedback',
                title: 'Feedback',
            }           
        ],  rowsGroup: [
                'feedback:name'
            ] , 
            pageLength: 30,
            lengthMenu: [[12, 30, 60,90, -1], [12, 30, 60,90, "All"]]

    })
    },
    error : function(data) {
        $('#datatable').dataTable().fnClearTable();
        console.log(data)
    }
})

Column index is getting changed

$
0
0

I am using datatable.js in visualforce page(Salesforce). So we show a lot of records in the page and we are using fixedheader js for freezing the headers. Also in the header sort click, I had overridden and make a call to my class to fetch latest data. The page has some inline editing also. So each time the data refreshes, the datatable is destroyed and re-initiated again.

So my problem is when I scroll down and edit a record, the page refreshes. When I scroll back to the top and click the header column, the index is showing wrong.

For eg: I have five columns in the table. After the inline edit, when I click the second column header it shows the index as 7 instead of 2

Any ideas?

How to pass the values of datatable row to spring mvc?

$
0
0

$(document).ready(function () {

        $('#datatables').DataTable({
            "dom": '<"toolbar">frtip',
            "responsive": true,
            "scrollY": "550px",
            "scrollCollapse": true,
            "ajax": "smsSenders.json",
            "aoColumns": [
                {"mData": "sender"},
                {"mData": "content"},
                {"mData": "receiveTime"},
                {"mData": "messageId","visible":false},
                {"mData": "portId",
                    "fnCreatedCell": function (nTd) {
                        $(nTd).html("<i class='ti-pencil-alt btn btn-simple btn-edit btn-icon' data-target='#replyModal' data-toggle='modal' data-mode='edit'></i>\n\n\
                        <i class='ti-comment-alt btn btn-simple btn-reply btn-icon' data-target='#replyMod' data-toggle='modal' data-mode='reply'></i>\
                     ");
                    }
                }
            ],
            language: {
                "search": "_INPUT_",
                searchPlaceholder: "Search records"
            }

        });

This is how I create my datatable.

is there any way to pass the values of the row where the button si clicked?

I am using spring mvc, orcale db running in tomcat.

How to display content of json file using jquery?

$
0
0

Hey guys I'm getting an error: Uncaught TypeError: Cannot read property 'length' of undefined

I am using java spring.

see below for my codes and the json file


How to structure an essay ?

$
0
0

For structuring essay there is best essay writing service.This is an on line essay service especially for college students. They provides best essay to college students who feel tough to manage the essay writing task.This service available at any time. All students can get away from worries and stress. They are helping students who are not very good in their essay papers and they provides custom writing papers with various unique features and offering best college essay to students who ask them to write essay.

How to export filename with special char as "&"?

$
0
0

Hi all,

I'm trying to export a file with "Mark & Tables Associated" as filename:

$(document).ready(function() {
    var dataSet = [
    [ "Tiger Nixon", "System Architect", "Edinburgh", "5421", "2011/04/25", "$320,800" ],
    [ "Garrett Winters", "Accountant", "Tokyo", "8422", "2011/07/25", "$170,750" ],
    [ "Ashton Cox<<<<<<<<", "Junior Technical Author", "San Francisco", "1562", "2009/01/12", "$86,000" ]
    ];

    $('#example').DataTable( {
        dom: 'Bfrtip',
        data: dataSet,
        columns: [
            { title: "Name" },
            { title: "Position" },
            { title: "Office" },
            { title: "Extn." },
            { title: "Start date" },
            { title: "Salary" }
        ],
        buttons: {
          buttons: [
              {
              extend: 'excel',
              title: null,
              text: "Export Company",
              filename: function () {
                return "Mark & Tables Associated";
              }
          }
          ]
        }
    });
});

but it seems it truncate the "&" char.
I'm on Windows. It shouldn't be denied as char.

How can I do it?

Why summary (FooterCollback) not work on my page?

$
0
0

Hello,

I have try to add such function:
https://datatables.net/examples/advanced_init/footer_callback.html
to my dt but it is not working. In chrome - console - show nothing, no errors from js. Footer looks like this:

<tfoot><th colspan="5">HAKUNAMATATA<div id="paging"></div></th></tfoot>

HAKUNAMATATA is showing but this script:

<script>
  $(document).ready(function() {
   'use strict'
    $('#tfv').dataTable(
     {
        "bJQueryUI": false,
        "bStateSave": true,
        "sPaginationType": "full_numbers",   
        "bLengthChange": true,
        "sDom": 'Rfrtlip', 
        "iDisplayLength": 100,
        "oLanguage": {"sLengthMenu": "Wyświetlanie:  _MENU_ rekordów na stronie",
                      "sZeroRecords": "Nic nie znaleziono",
                      "sInfo": "Wyświetlone od _START_ do _END_ z _TOTAL_ rekordów",
                      "sInfoEmpty": "Wyświetlone od 0 do 0 z 0 rekordów",
                      "sInfoFiltered": "(filtered from _MAX_ total records)",
                      "oPaginate": {"sFirst": "Pierwsza",          
                                    "sLast": "Ostatnia",
                                    "sNext": "Następna",
                                    "sPrevious": "Poprzednia"}
                     },
        "footerCallback": function (row, data, start, end, display) {
            var api = this.api(),
                data;
 
            // Remove the formatting to get integer data for summation
            var intVal = function (i) {
                return typeof i === 'string' ? i.replace(/[\$,]/g, '') * 1 : typeof i === 'number' ? i : 0;
            };
 
            // Total over all pages
            total = api.column(4)
                .data()
                .reduce(function (total, b) {
                b = $(b.replace('$', '')).text();
                return total + parseInt(b);
            },0);
            // Total over this page
            pageTotal = api.column(4, {
                page: 'current'
            })
                .data()
                .reduce(function (total, b) {
                b = $(b.replace('$', '')).text();
                return total + parseInt(b);
            }, 0);
 
            // Update footer
            $(api.column(4).footer()).html(
                '$' + pageTotal + ' ( $' + total + ' total)');
        }
     } 
    ).yadcf
    (
      [
        {
          column_number:1,
          filter_type: "multi_select",
          select_type: 'select2'
        }
      ]
    )
    SyntaxHighlighter.all();
    });</script>

does nothing ... can someone help with this?

Minimo de colunas no DataTables (Minimum of columns in DataTables)

$
0
0

Olá, tenho um problema, quando tento fazer uma tabela com 4 colunas ou menos o DataTables não inicializa dando o seguinte erro no console. :s

Hello, I have a problem, when I try to make a table with 4 columns or less the DataTables does not start giving the following error in the console.

jquery.min.js:2 Uncaught TypeError: Cannot set property '_DT_CellIndex' of undefined
at P (jquery.dataTables.min.js:4)
at D (jquery.dataTables.min.js:4)
at HTMLTableRowElement.<anonymous> (jquery.dataTables.min.js:4)
at jquery.min.js:2
at Function.map (jquery.min.js:2)
at w.fn.init.map (jquery.min.js:2)
at y (jquery.dataTables.min.js:4)
at U (jquery.dataTables.min.js:4)
at s (jquery.dataTables.min.js:4)
at At (jquery.dataTables.min.js:4)

I need Help.
Thanks

Exported PDF file doesnt show Turkish currency symbol ₺

$
0
0

Hello everyone,

Exported PDF file from datatables doesnt show ₺ (turkish currency symbol) . There are not problem for another money currency symbol for ex. $, € etc... In addition. when I exported datatables with excel there are not problem it works perfectly.

What can I do about this problem?

Thanks,
Best Regards

How to display generic json event to show data instead of [Object object]

$
0
0

Hello,
I have a device that sends a json with different events in this way
[ {"timestamp": 12387414, "event": {"foo": "data1"} }]
[ {"timestamp": 12387414, "event": {"bar": "data2"} }]

and this datatable initialization

infoTable = $('#infoTable').DataTable({
        data:  infoData, /*function() {

                return JSON.stringify(infoData[0].timestamp);
        },*/

        "paging": false,
        "scrollY": "400px",
        scrollCollapse: true,

        "language": {
            "emptyTable": "No data available in table",
            "infoEmpty": "No entries to show"
        },

        columnsDefs: [
            { "width": "20%", "targets": 0 },
        ],

        aoColumns: [    
            { data: 'timestamp' },
            //{ data: 'event'}
            {   mData: 'event',
                mRender: WHAT HERE?

            }
        ]
});

What should I do instead of WHAT HERE? ?

Thank you

Export csv and xl is exporting only page 1 data. I need all data

$
0
0

This is my button code :: please help
// Download Button
var table = $('#user_data').DataTable();
var buttons = new $.fn.dataTable.Buttons(table, {
buttons: [
// 'excelHtml5',
// 'csvHtml5'
{
extend: 'excelHtml5',
footer: false,
exportOptions: {
columns: [0,1,2,3,4,5,7,8,9,10]
}
},
{
extend: 'csvHtml5',
footer: false,
exportOptions: {
columns: [0,1,2,3,4,5,7,8,9,10]
}
}
]
}).container().appendTo($('#buttons'));
//


Need help on Export csv and xl not exporting all Data

$
0
0

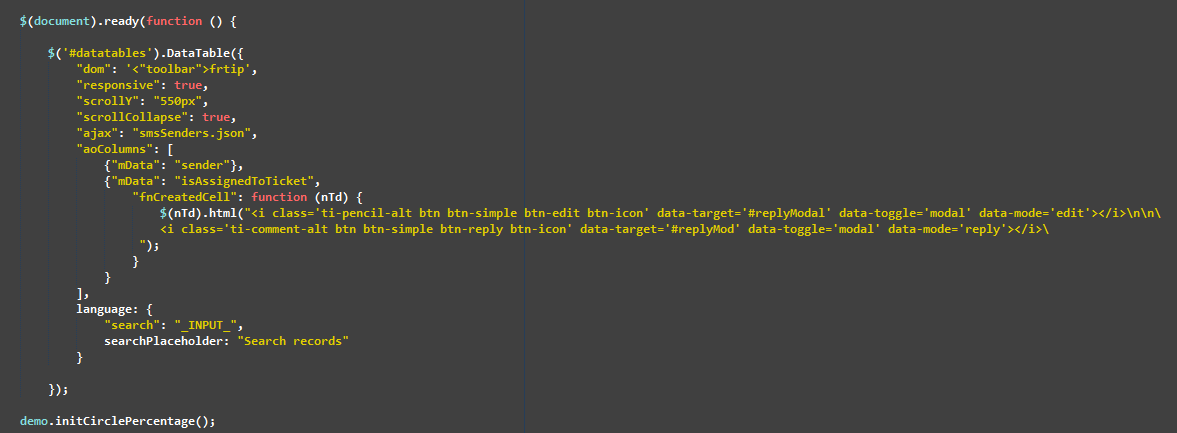
This is my code for datatable and export button:
$(document).ready(function(){
var dataTable = $('#user_data').DataTable({
"sDom": "Rlfrtip",
"fixedHeader": true,
"processing":true,
"serverSide":true,
"order":[],
"ajax":{
url:"<?php echo base_url() . 'admin/fetch_store'; ?>",
type:"POST" ,
"data":function(data) {
data.country = $('#country').val();
data.state = $('#state').val();
data.city = $('#city').val();
data.email = $('#email').val();
data.contact_number = $('#contact_number').val();
data.activity = $('#activity').val();
data.start_date = $('#start_date').val();
data.end_date = $('#end_date').val();
},
},

       "columnDefs":[  
            {  
                 "targets":[0, 12 ],  
                 "orderable":false,  
            },  
       ]

  }); 

// Download Button
var table = $('#user_data').DataTable();
var buttons = new $.fn.dataTable.Buttons(table, {
buttons: [
// 'excelHtml5',
// 'csvHtml5'
{
extend: 'excelHtml5',
footer: false,
exportOptions: {
columns: [0,1,2,3,4,5,7,8,9,10]
}
},
{
extend: 'csvHtml5',
footer: false,
exportOptions: {
columns: [0,1,2,3,4,5,7,8,9,10]
}
}
]
}).container().appendTo($('#buttons'));
//

    $('#search').on( 'click', function (event) {
       event.preventDefault();
               //
            var email = $('#email').val();
            var contact_number = $('#contact_number').val();
            if(email!=''){
               if(validateEmail(email)==false){
        $("#error_email").html("<div class='text-danger'>please enter valid email!</div>");
        $("#email").focus();
        return false;
    } 
    }

               //
       var start_date = $('#start_date').val();
       var end_date = $('#end_date').val();
       if(start_date=='' || end_date=='')
       {
          dataTable.draw(); 
       }
       else if(start_date <= end_date) {
         dataTable.draw();
       } 
               else {
         alert("Your start date can not be less than end date!");
        return false;            
       }

    } );

order() without draw()

$
0
0

Hey,
is it possible to order the table but not output it again?
Because when I run the code below I always got the original order (column 0):

var table = $('#example').DataTable();
table.order( [ 1, 'asc' ] );
console.log(table.columns([0,1]).data());

I'd like to do some calculations in the background.
Thank you :)

DataTable sorting with a select by html content

$
0
0

I have a dataTable with custom filters on each columns. In the body of some columns I have some html with icons like this (Sorry I didn't arrive to use Code preview) :

<tbody>
<tr>
<td><i class="fa fa-retweet" data-search="test" data-order="test" aria-hidden="true"></i></td>
<td>Other column</td>
</tr><tr>
<td><i class="fa fa-calendar" data-search="cal" data-order="cal" aria-hidden="true"></i></td>
<td>Other column</td>
</tr><tr>
<td><i class="fa fa-cogs" data-search="co" data-order="coemphasized text" aria-hidden="true"></i></td>
<td>Other column</td>
</tr>
</tbody>

The filter of the first column is an HTML select with several icons in options, when I select one option, it's return me a value equal to one of the data-search present on each line in column 1.

For exemple I choose icon fa-calendar in the select box (value is cal), I just want to show the line where there is class fa-calendar or data-search="cal"

I tried to use the dataTable.search with the value but it's doesn't work :

myDatatable.column(1).search(value).draw();

To finish, I used columnDefs, to set HTML type to my column :

columnDefs: [{ targets: 1, type: "html" }],

Is there someone who already tried to set a filter who sorts column by one of the html attributepresent in the column body ?

Thanks

applying background color to cell having red color text in table

$
0
0

Hi Allan,

My table contains red color texts in TD's which shows the difference in the amount. What I want is, when exported to excel I want those cells to apply background fill when exported to excel. please find the below code where we need to apply cell styling for the cells showing the difference in the amount.

https://codepen.io/anon/pen/xJXXPB

how to apply background fill to those particular cells I have marked in the screenshot. Please reply with the code.

Thanks in advance.

S Pankaj Sharma

Export row vertical align top (or middle) keeping cells that got new lines?

$
0
0

Hi there,

I've some table cell with complex data, not only a simple string, but a sort of div-grid table nested into the cell.
So I'm exporting it keeping new lines, in this way, extendings buttons:

$.extend(true, $.fn.dataTable.defaults, {
    buttons: {
        buttons: [
            {
                extend: 'excel',
                exportOptions: {
                    format: {
                        body: function (data, row, column, node) {
                            var result = data;
                            var columnIndex = GetColumnIndexByColumnName("MissingPayments", true);

                            if (column == columnIndex) {
                                result = "";

                                var cellGrid = $(node).find('.cell-grid');
                                var cellGridRows = cellGrid.find('.cell-grid-row.active');

                                cellGridRows.each(function (index, row) {
                                    var cellGridRowsColsArray = $(row).find('.cell-grid-col').map(function () { return $(this).text(); }).get();

                                    var row = cellGridRowsColsArray[0] + ": " + cellGridRowsColsArray[1] + " (" + cellGridRowsColsArray[2] + ")";

                                    result += row + "\r\n";
                                });
                            }

                            return result.trim();
                        }
                    }
                },
                customize: function (xlsx) {
                    var sheet1 = xlsx.xl.worksheets['sheet1.xml'];
                    var columnIndex = GetColumnIndexByColumnName("MissingPayments", true);
                    var columnLetter = GetLetterByNumber(columnIndex).toUpperCase();

                    $('row c[r^="' + columnLetter + '"]', sheet1).attr('s', '55');
                    $('row:first c', sheet1).attr('s', '2'); // overwrite first row, so it keeps bold
                }
            }
        ]
    }
});

It works perfectly, but the row with a single line become vertically aligned to the bottom on the excel.

How can I align them to the top (or middle) keeping the wrap text on the selected column?
Thanks, you are very helping me in these days!

Viewing all 82207 articles
Browse latest View live


<script src="https://jsc.adskeeper.com/r/s/rssing.com.1596347.js" async> </script>