Quantcast
Channel: Recent Discussions — DataTables forums
Viewing all 81384 articles
Browse latest View live

Child rows with editor

$
0
0

looking at the child row example: https://datatables.net/examples/api/row_details.html

i want to build the same thing, but the child row would again be a datatable with an editor, so i can add/edit/delete rows inside the child row, are there any examples like this as i can seem to make this work.

Maybe i'm making this to complicated but i'm trying to edit a 1 to many relationship, but in the secondary table (the many) we can add rows, and these rows are build out of 5 fields (below is an explanation of the sql tables).

members
- id
- name
- address
- ....

members_year
- id
- member_id
- year
- medical
- payed
- submitted

any help on how to build this would be really handy.


Select cell not working after ajax loaded new datas from server

$
0
0

Dear Allan!
I want to search data in datatables (not filter, or search), and select cell when I found data, and scroll to selcted cell.
Its woking when ajax not loaded new block from server.
Can You tell me what event run when data loaded, and can you test this problem?

You can test this:
log my test system, and type in Keresés cell qqqq and press right arrow on screen.
The select found qqqq in cell and will selkect, and scroll to cell.
Press right arrow key on screen again, the ajax runing and after process endig, the cell not select.
Press right arrow key on screen again, the ajax not runing and the founded cell selected.

You can test:
http://infoportal-hu.ddns.net:62080/index.php?module=TablePage&ID=25
You can login:
email:allandatatables@gmail.com
Jelszó:
AllanDatatables
If you logged in jump again http://infoportal-hu.ddns.net:62080/index.php?module=TablePage&ID=25

Thanks:
Gyula

row child

$
0
0

please help me friends!
I have ready table with data and some rows has nested table (like this)) but with ready data, and all of data was renderind with python in my html page. i want here use DataTable and to bind nested table. If i use datatable without nested table it works, else returned so error: (TypeError: Cannot set property '_DT_CellIndex' of undefined). how can I resolve this problem ?

Datatables Scrolling Data not being Called

$
0
0

Hello!

I've been trying to use the datatables scroller to load data dynamically as the scrolling happens. The only problem I'm having is with triggering the ajax to fire again. It doesn't call the ajax in an appropriate position in the table. The same problem occurs in the 50k example on this website.

I've been able to get it to fire by manually setting a height between 25 and 50 viewport height. Here's my initialization:

DOM:

`<table id="permissionsTableList" class="hbs-grid hbs-list" style=" width:98%;height: 25vh !important">
        <thead>

        </thead>
        <tbody></tbody>
    </table>
`

Datatables initialization:

 $('#permissionsTableList').dataTable({
                destroy: reinit,
                "bScrollInfinite": true,
                "bScrollCollapse": true,
                "order": [0, 'asc'],
               "deferRender": true,
                "scrollY": "50vh",
                "serverSide": true,
                "scroller": {
                    loadingIndicator: true,
                    
                },
                "ajax": function (data, callback, settings) {

                    $.ajax({
                        type: "GET",
                        url: "URL?handler=GetData",
                        data: { start: data.start, length: 50 },
                        beforeSend: function (xhr) {
                            xhr.setRequestHeader("XSRF-TOKEN",
                                $('input:hidden[name="__RequestVerificationToken"]').val());
                        },
                        success: function (d) {
                                setTimeout(function () {
                                    callback({
                                    draw: data.draw,
                                    data: d,
                                    recordsTotal: @Model.Data.Count(),
                                    recordsFiltered: @Model.Data.Count(),
                                });
                            }, 50)
                        }
                    })
                },

Any help figuring out this problem is apprfiated.

Class no-footer applied to Table despite a footer is present.

$
0
0

I'm using Datatables 1.10.13 with the jQuery UI styling options. Somehow DataTables must think there is no footer present, as the maintable gets the class "no-footer" applied. Wouldn't bother me much, but an ugly

border-bottom: 1px;

is applied, that doesn't really fit. You even have that feature/problem on your example: https://datatables.net/manual/styling/jqueryui

  • Is this a bug?
  • How can I remove it without modifiying the js or css source?

I'd like to avoid using something like

$(table).removeClass("no-footer");

Custom data in cells recieved as array from JSON

$
0
0

Hello,
I'd like to know if we can format data before to display it into dataTable.
I get a json with this structure for instance:

{
"id": "TEST3",
"lastLoginDate": null,
"createDate": "Dec 19, 2018 4:36:43 PM",
"updateDate": "Dec 19, 2018 4:36:43 PM",
"active": 1,
"roles": ["ROLE_SUPER_ADMIN", "ROLE_ADMIN", "ROLE_USER"]
}

Here's my dataTable :

I'd like to add space or a line break or any css style. Is that possible ?

Here's my code :

    function drawTable(){
        currentTable = $('#dataTables').DataTable({
            responsive: false,
            ajax: {
                "url": restURI + 'orch/search/all/users/',
                "type": "POST",
                "contentType": 'application/json',
                "dataSrc": ""
            },
            order: [0, 'asc'],
            scrollCollapse: true,
            scrollX: false,
            "columns": [
                { "data": "id", "defaultContent": "", "sClass": "text-center limitedWidth" },
                { "data": "roles", "defaultContent": "", "sClass": "text-center limitedWidth" },
                { "data": "lastLoginDate", "defaultContent": "", "sClass": "text-center limitedWidth" },
                { "data": "createDate", "defaultContent": "", "sClass": "text-center limitedWidth" },
                { "data": "updateDate", "defaultContent": "", "sClass": "text-center limitedWidth" },
                { "data": "active", "defaultContent": "", "sClass": "text-center limitedWidth" },
                { "data": null, "defaultContent": "<button class=\"btn btn-warning inline\">Desactivate</button><button class=\"btn btn-success inline\">Activate</button><button class=\"btn btn-info inline\">Update</button>", "bSortable": false, "sWidth": "85px", "sClass": "text-center limitedWidth"}
            ],
            'rowCallback': function(row, data, index) {
                if(data.active == "1") {
                    $(row).find('td:eq(6)>button:eq(0)').hide();
                } else {
                    $(row).find('td:eq(6)>button:eq(1)').hide();
                }
            }
        });
    }

Thank you !

pagination

$
0
0

i table show in pagination render pagination 1 selected . how to make select pagination length 2 select default when page load

Turning on responsive options breaks my dropdown popper.js menu in the Datatable

$
0
0

Using bootstrap dropdown button, which depends on popper.js. All is good with responsive: false but the menu has some sort of z-index/scrolling issue when responsive: true

Absolutely amazing demonstration:
https://imgur.com/a/JNXpxyd

and of course the html

<div class="col-sm-12 table-responsive">
    <table id="#" class="display">
        <thead>
            <tr>
                <th>Actions</th>
            </tr>
        </thead>
        <tbody>
          <td>
            <div class='btn-group dropdown'>
                <button type='button' class='btn btn-warning dropdown-toggle' data-toggle='dropdown' aria-haspopup='true' aria-expanded='false'>
                 Actions
                </button>
                <div class='dropdown-menu' role='menu' aria-labelledby='dLabel'>
                    <a class='dropdown-item' href='#' row=''>Rename</a>
                    <a class='dropdown-item' href='#' row=''>Change Release Date</a>
                    <a class='dropdown-item' href=''>Download file</a>
                    <div class='dropdown-divider'></div>
                    <a class='dropdown-item' href='#' row=''>Delete</a>
                </div>
              </div>
            </td>
        </tbody>
     </table>

Row Data in Advanced Datatables ( master details )

$
0
0

I am trying to create advanced datatables like the example # 2 in this https://quickadminpanel.com/blog/advanced-datatables-with-laravel-five-code-examples/

and my code is same as what they did , using ajax in this codehttps://github.com/LaravelDaily/Laravel-Datatables-Advanced/blob/master/resources/views/customers/master_details.blade.php

so i have now master table and inside each row there is details table
and i added action in master rows
its work perfect but when i want to add action to every row in the details table I cant get row data

any idea ?

Json format issue

$
0
0

Hi Guys,

I am extracting some data from an SLQITE database as follows:

var newJson =[];

    btnFind.onclick=function()
        {
  sqlList=[];
  sqlList[0]=["SELECT * FROM studentData2 ", nameFound];
  Sql(DB, sqlList);
        }

I extract the data

function nameFound(transaction, results) {
  if(results.rows.length>0) {
     newJson=[];
     for (var k = 0; k < results.rows.length; k++) {

                    var row = results.rows.item(k);
if(k > 0) newJson += ',';
                    newJson += '{ "name":"' + row.name + '", "age":"' + row.age + '", "Field2":"' + row.Field2 + '", "Field3":"' + row.Field3 + '", "Field4":"' + row.Field4 + '", "Field5":"' + row.Field5 + '"}';
                 

                }

                jsonall = newJson + ']}';
                newJson = '['+newJson+']';
                alert(newJson); //shows me a correct JSON as string
               

   // NSB.MsgBox(results.rows.item(0).name  +  " is "  +  results.rows.item(0).age);
 }

I get the result.

[{ "name":"Ste", "age":"59", "Field2":"undefined", "Field3":"undefined", "Field4":"undefined", "Field5":"undefined"},{ "name":"Ste2", "age":"60", "Field2":"undefined", "Field3":"undefined", "Field4":"undefined", "Field5":"undefined"}]

I test this at https://jsonformatter.org/ and it shows as vaild Json.

If I use the following it works. ie copy the json data into
'''
var newJson = [{ "name":"Ste", "age":"59", "Field2":"undefined", "Field3":"undefined", "Field4":"undefined", "Field5":"undefined"},{ "name":"Ste2", "age":"60", "Field2":"undefined", "Field3":"undefined", "Field4":"undefined", "Field5":"undefined"}];

$("#dtContacts").dataTable().fnDestroy();
$('#dtContacts').empty();
tableContacts = $('#dtContacts').DataTable( {
'data':newJson,
'columns': [
{ 'data' : 'name' , title : 'Name'},
{ 'data': 'age' , title : 'Age'}
]
})

But if I try to use newJson directly I get errors 

DataTables warning: table id=dtContacts - Requested unknown parameter 'name' for row 0, column 0. For more information about this error, please see http://datatables.net/tn/4
```

Is there something I am not understanding about the format of newJson

Cheers

Steve Warby

Set the search field's value and sort the dataTable

$
0
0

Hello,
I retrieve the cell's value on double click and set the search's value to the cell's value in order to sort by the cell's value.
The issue I have is the dataTable is not updating when I set the search's value, it only works when I type on keyboard.
Is there a way to make it works as I expected ?

Here's my code :

$(document).ready(function() {

    $('#dataTables tbody').on('dblclick', 'td', function () {
    searchValue = currentTable.cell(this).data();
    });
});
'rowCallback': function(row, data, index) {
            $(row).dblclick(function() {
                $('#dataTables_filter input').val(searchValue);
            });
}

Thank you !

NaN columnDefs

$
0
0

Hi, can somebody tell what I'm missing/doing wrong with the following code? The result in the front end is NaN being displayed rather than the desired result. Seem to be going round in circles trying to see what's wrong I'm sure somebody will spot it straight away and it's me being a bit slow!

{
                    targets: ['each_cost_price'],
                    render: function(data, type, row, meta) {
                        if (row['cost'] && row['unit'] && row['exrate'] !== null && data == null) {
                            return (row['cost'] / row['exrate'] / row['unit']).toFixed(2);
                        } else {
                            return (data == null) ? "" : "£" + data;
                        }
                    }
                }

Datatable PDF row grouping

$
0
0

Hi I can group datatable rows in verilog. But how can i do this when I import pdf export output? I have been searching but could not find a solution.
I need to group PDF Export lines

Can you help me?

Row grouping with printing

$
0
0

I believe i solved the problem with printing with row grouping. I found a snippet of code on StackOverflow here and was able to fix it up to work with row grouping. This is placed in datatable-buttons.js on line 1564.

Heres some images of it working!
http://prntscr.com/fhx1vu
http://prntscr.com/fhx1ia

    var _exportData = function ( dt, inOpts )
    {

        var config = $.extend( true, {}, {
            rows:           null,
            columns:        '',
            grouped_array_index: [],
            modifier:       {
                search: 'applied',
                order:  'applied'
            },
            orthogonal:     'display',
            stripHtml:      true,
            stripNewlines:  true,
            decodeEntities: true,
            trim:           true,
            format:         {
                header: function ( d ) {
                    return strip( d );
                },
                footer: function ( d ) {
                    return strip( d );
                },
                body: function ( d ) {
                    return strip( d );
                }
            }

        }, inOpts );

        var strip = function ( str ) {
            if ( typeof str !== 'string' ) {
                return str;
            }

            // Always remove script tags
            str = str.replace( /<script\b[^<]*(?:(?!<\/script>)<[^<]*)*<\/script>/gi, '' );

            if ( config.stripHtml ) {
                str = str.replace( /<[^>]*>/g, '' );
            }

            if ( config.trim ) {
                str = str.replace( /^\s+|\s+$/g, '' );
            }

            if ( config.stripNewlines ) {
                str = str.replace( /\n/g, ' ' );
            }

            if ( config.decodeEntities ) {
                _exportTextarea.innerHTML = str;
                str = _exportTextarea.value;
            }

            return str;
        };


        var header = dt.columns( config.columns ).indexes().map( function (idx) {
            var el = dt.column( idx ).header();
            return config.format.header( el.innerHTML, idx, el );
        } ).toArray();

        var footer = dt.table().footer() ?
            dt.columns( config.columns ).indexes().map( function (idx) {
                var el = dt.column( idx ).footer();
                return config.format.footer( el ? el.innerHTML : '', idx, el );
            } ).toArray() :
            null;

        var rowIndexes = dt.rows( config.rows, config.modifier ).indexes().toArray();
        var selectedCells = dt.cells( rowIndexes, config.columns );
        var cells = selectedCells
            .render( config.orthogonal )
            .toArray();
        var cellNodes = selectedCells
            .nodes()
            .toArray();

        var grouped_array_index     = config.grouped_array_index;                     //customised
        var no_of_columns           = header.length;
        var no_of_rows              = no_of_columns > 0 ? cells.length / no_of_columns : 0;
        var body                    = new Array( no_of_rows );
        var body_data               = new Array( no_of_rows );                                //customised
        var body_with_nodes         = new Array( no_of_rows );                          //customised
        var body_with_nodes_static  = new Array( no_of_rows );                          //customised
        var cellCounter             = 0;

        for (var i = 0, ien = no_of_rows; i < ien; i++)
        {
            var rows            = new Array( no_of_columns );
            var rows_with_nodes = new Array( no_of_columns );

            for ( var j=0 ; j<no_of_columns ; j++ )
            {
                rows[j]             = config.format.body( cells[ cellCounter ], i, j, cellNodes[ cellCounter ] );
                rows_with_nodes[j]  = config.format.body( cellNodes[ cellCounter ], i, j, cells[ cellCounter ] ).outerHTML;
                cellCounter++;
            }

            body[i]                     = rows;
            body_data[i]                = rows;
            body_with_nodes[i]          = $.parseHTML('<tr class="even">'+rows_with_nodes.join("")+'</tr>');
            body_with_nodes_static[i]   = $.parseHTML('<tr class="even">'+rows_with_nodes.join("")+'</tr>');
        }

        /******************************************** GROUP DATA *****************************************************/
        var row_array                       = dt.rows().nodes();
        var row_data_array                  = dt.rows().data();
        var iColspan                        = no_of_columns;
        var sLastGroup                      = "";
        var inner_html                      = '',
            grouped_index;
        var individual_group_array          = [],
            sub_group_array                 = [],
            total_group_array               = [];
        var no_of_splices                   = 0;  //to keep track of no of element insertion into the array as index changes after splicing one element

        for (var i = 0, row_length = body_with_nodes.length; i < row_length; i++)
        {
            sub_group_array[i]              = [];
            individual_group_array[i]       = [];

            var sGroup                      = '';

            for(var k = 0; k < grouped_array_index.length; k++)
            {
                sGroup                          = row_data_array[i][grouped_array_index[k]];
                inner_html                      = row_data_array[i][grouped_array_index[k]];
                grouped_index                   = k;
                individual_group_array[i][k]    = row_data_array[i][grouped_array_index[k]];
                sub_group_array[i][k]           = sGroup;
            }

            total_group_array[i] = sGroup;


            console.log("grouped_index",grouped_index);

            if ( sGroup !== sLastGroup )
            {
                var table_data              = [];
                var table_data_with_node    = '';

                for(var $column_index = 0;$column_index < iColspan;$column_index++)
                {
                    if($column_index === 0)
                    {
                        table_data_with_node        += '<td style="border-left:none;border-right:none">'+inner_html+'</td>';
                        table_data[$column_index]   = inner_html + " ";
                    }
                    else
                    {
                        table_data_with_node        += '<td style="border-left:none;border-right:none"></td>';
                        table_data[$column_index]   = '';
                    }
                }

                body_with_nodes.splice(i + no_of_splices, 0, $.parseHTML('<tr class="group group_'+grouped_index+' grouped-array-index_'+grouped_array_index[grouped_index]+'">'+table_data_with_node+'</tr>'));
                body_data.splice(i + no_of_splices, 0, table_data);
                no_of_splices++;
                sLastGroup = sGroup;
            }
        }

        return {
            header: header,
            footer: footer,
            body:   body_data
        };
    };

Usage:
Define grouped_array_index in exportOptions

 exportOptions: {
        // Any other settings used
        grouped_array_index: [<place row to use here>],
 },

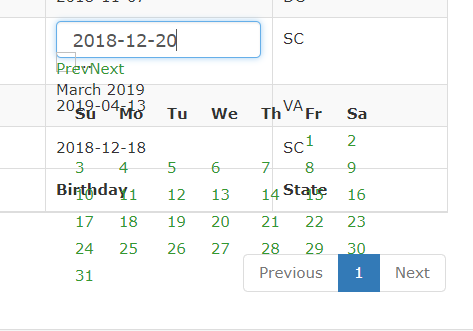
How do I change the style of the date picker for a date field type?

$
0
0

The date picker has a transparent background and the style is slightly off. I am using Bootstrap 3. Any suggestions?

label: "birthday:",
                 name: "birthday",
                 type: "date",
                 dateFormat: "yy-mm-dd"


Deselect All Checkboxes Except Current - Not working on Pages > 1

$
0
0

I want the code to deselect anything but the current selection, and to deselect anything checked on other pages.. If I set all the checkboxes to false, the code only works from the first page, not from any pages > 1

@Styles.Render("~/Content/DataTables")
@Scripts.Render("~/bundles/DataTables")

<script>

 $(document).ready(function () {
        $('#results').DataTable({
            columnDefs: [
                {
                    className: 'dt-nowrap',
                    targets: 1
                },
                {
                    className: 'dt-center',
                    targets: [1,2]
                }
            ],
            "paging": true,
            "pageLength": 10,
            "lengthMenu": [[10, 20, 40, -1], [10, 20, 40, "All"]],
            "order": [[0, "asc"]],
            "searching": false,
            "sort": false,
            "deferRender": true
        });

        //prevent enter from submitting form
        $(document).keydown(function (e) {
            if (e.keyCode == 13) {
                return false;
            }
        });
 
    });

    $(function () {
        $("input").change(function (e) {
            e.preventDefault();
            var table = $('#results').dataTable();
            $('input', table.fnGetNodes()).prop('checked', false);
            $(this).prop("checked", true);
        });

</script>

The bundles are as follows:

    bundles.Add(New StyleBundle("~/Content/DataTables").Include(
                "~/DataTables/datatables.min.css"))

    bundles.Add(New ScriptBundle("~/bundles/DataTables").Include(
                "~/DataTables/datatables.min.js"))

What am I doing wrong, or rather, what is the correct way to resolve this?

Problem with export in tabbed pages

$
0
0

I have a SPA application where I have problems to export data from some of the datatables. It seems to me that if the datatables are contained in different containers or pages they will work but i can't quite figure it out. For example a page
with a table like this

<div vxa-role="page" vxa-page="employees" vxa-init-function="EmployeeService.LoadEmployees()" vxa-show-function="EmployeeService.LoadEmployees()" class="collapse">
            <div class="container-fluid">
                <br>Behöriga tjänstemän<br>
                <table id="editEmployeeTable" class="table table-hover" cellspacing="0" width="100%">
                    <thead>
                        <tr>
                            <th>Namn</th>
                            <th>TjänstemannaNr</th>
                            <th>AnvändarId</th>
                        </tr>
                    </thead>
                    <tbody></tbody>
                </table>
            </div>
        </div>

The export will work but not in a page like

<div class="tab-pane" id="car-tabber-herds" role="tabpanel">
                        <form id="editCarResponsibilityTableForm">
                            <div class="container-fluid">
                                <table id="editCarResponsibilityTable" class="table table-hover" cellspacing="0" width="100%">
                                    <thead>
                                        <tr>
                                            <th>SE-nummer</th>
                                            <th>Gårdsnamn</th>
                                            <th>Adress</th>
                                            <th></th>
                                        </tr>
                                    </thead>
                                    <tbody></tbody>
                                </table>
                            </div>
                        </form>
                    </div>

Both tables use an editor and are initiated with similar code like below

employeeTable = $('#editEmployeeTable').DataTable({
            'language': {
                'url': '/js/language/datatables_swe.json'
            },
            'dom': 'Bfrtip',
            'buttons': [
                {
                    extend: 'collection',
                    text: 'Exportera',
                    buttons: [
                        'excel',
                        'pdf'
                    ]
                },
                //,
                { extend: "create", editor: editor },
                { extend: "edit", editor: editor },
                {
                    extend: "remove",
                    editor: editor,
                    formMessage: function (e, dt) {
                        var rows = dt.rows(e.modifier()).data().pluck('name');
                        return 'Är du säker på att du vill radera ' +
                            'följande tjänsteman(män)? <ul><li>' + rows.join('</li><li>') + '</li></ul>';
                    }
                }
            ],
            'lengthChange': false,
            'order': [1, 'asc'],
            'select': {
                style: 'single'
            },
            'columns': [

I'd be grateful for any suggestions as this is a real showstopper

Record Truncation at ~17K - Works on Chrome, Sometimes not on IE - What could be wrong?

$
0
0

One of my DataTable displays using ASP.NET needs to show all of the records returned from a stored procedure, anywhere from 5 to 18000, depending on the data. The front-end is ASP.NET MVC and the result is fine on my computer in both IE and Chrome but only shows records greater than approximately 17,600 on a peer's IE. Chrome is fine for them. The code is not using Ajax or doing any paging, although I might consider it to improve performance.

Is there a meta tag or something similar that needs to be set to resolve this issue? Anything i should be looking at?

File uploaded to a field that does not have upload options configured

$
0
0

Hi, when I'm trying to upload a file I have an error: "File uploaded to a field that does not have upload options configured". Help me please

Controller:

public ActionResult JTovar()
{
var request = System.Web.HttpContext.Current.Request;
var settings = Properties.Settings.Default;
using (var db = new DataTables.Database(settings.Dbtype, settings.DbConnection))
{
var response = new Editor(db, "Tovar", "id")
.Model<ModelTovar>()
.Field(new Field("Tovar.id"))

                .MJoin(new MJoin("image")
                        .Link("Tovar.id", "interImage.idTovar")
                        .Link("image.id", "interImage.idImage")
                .Model<MjoinImageTovar>()
                .Field(
                   new Field("Tovar.Links")                                     
                       .Upload(
                       new Upload(request.PhysicalApplicationPath + @"uploads\__ID____EXTN__")
                       .Db("image", "id", new Dictionary<string, object>
                       {
                          {"fileName", Upload.DbType.FileName},
                          {"fileSize", Upload.DbType.FileSize},
                          {"webPath", Upload.DbType.WebPath},
                          {"systemPath", Upload.DbType.SystemPath}
                       })
                       .Validator(Validation.FileSize(50000000, "Max file size is 500000K."))
                       .Validator(Validation.FileExtensions(new[] { "jpg", "png", "gif","html","htm" }, "Please upload an image or html file."))
                              )
                      .SetFormatter(Format.NullEmpty())
                        )                  
                      )
                .Process(request)
                .Data();
            return Json(response, JsonRequestBehavior.AllowGet);
        }

}

JS: {
label: "Links:",
name: "Tovar.Links",
type: "uploadMany",
display: function (id) {
return '<img src="' + editor.file('image', id).webPath + '"/>';
},
noImageText:'No image'

}

{
data: "Tovar.Links",
render: function (data)
{
console.log(data);
return data?
data.length + ' files(s)' :
'No file';
},
title: "Image"

}

Models:
public class MjoinImageTovar
{
public class interImage
{
public int id { get; set; }
public int idTovar { get; set; }
public int idImage { get; set; }

    }
    public class image
    {
        public int id { get; set; }
        public string fileName { get; set; }
        public int fileSize { get; set; }
        public string webPath { get; set; }
        public string systemPath { get; set; }
    }

}

public class ModelTovar
{
public class Tovar
{
public int id { get; set; }
public string Links { get; set; }

    }

Accessibility error

$
0
0

Using the Site Improve chrome extension I get an error, HTML is used to format content 1.3.1 Info and Relationships. If you use it on the home page of datatables.net you can see it is showing an error there as well. Ours is for valign, yours is for border. The error is coming from inline styling, is there a way to exclude inline styling?

Viewing all 81384 articles
Browse latest View live


<script src="https://jsc.adskeeper.com/r/s/rssing.com.1596347.js" async> </script>