Quantcast
Channel: Recent Discussions — DataTables forums
Viewing all 81384 articles
Browse latest View live

Generate dynamic columns with a variable string doesn't work

$
0
0

Hi everybody,

I'm trying to generate a dynamic DataTable according to a variable $_GET. So I generate a string according to the columns name and their type (only important for dates so I can sort them even if they're formatted).
My problem is that when I do columns: s_dynamicColumns, I have in my console this Error "Uncaught TypeError: Cannot use 'in' operator to search for 'length' in [" and the DataTable is not generate.

The thing that I don't understand is when I console.log my variable I've got this :
[{"title": "Prénom"},{"title": "Nom"},{"title": "Poste"},{"title": "Date d'arrivée", 'type': 'date-eu'},{"title": "Salaire"}]
and when I copy/paste this like this :
columns: [{"title": "Prénom"},{"title": "Nom"},{"title": "Poste"},{"title": "Date d'arrivée", "type": "date-eu"},{"title": "Salaire"}],
it works.

I've noticed that to generate the DataTable I can take off all the line "columns: ...," and it works but in that case I can't sort my dates anymore.

Do you have any ideas of where the problem come from ?

There is my javascript file :

$(document).ready(function(){

    var s_variableGet = window.location.search.substring(1);
    var a_split = s_variableGet.split("=", 2);
    var o_dataSet =  decodeURI(a_split[1]);

    o_dataSet = JSON.parse(o_dataSet);
    var a_columns = o_dataSet['columns'];
    var a_rows = o_dataSet['rows'];

   var s_dynamicColumns = "[";

    for(var z=0; z < a_columns.length; z++){
        if(a_columns[z]['type'] == 'date'){
            var type = ", 'type': 'date-eu'";
        }else{var type = '';}
        if(z == 0){
            s_dynamicColumns+= '{"title": "'+ a_columns[z]["nom"] + '"'+type+'}';}
        else{
            s_dynamicColumns+= ',{"title": "'+ a_columns[z]["nom"] + '"'+type+'}';
        }
        $('#resultat-requete thead tr').append('<th>'+a_columns[z]['nom']+'</th>');
    }
    s_dynamicColumns+= "]";

    var hauteurGrid = $(window).height() - 120;

    console.log(s_dynamicColumns);

    tableResultatRequete = $('#resultat-requete').on('preXhr.dt', function (e, settings, data) {
        }).DataTable({
        data: a_rows,
        scrollY: hauteurGrid,
        order: [],
        //columns: s_dynamicColumns, <-- there is the way that doesn't work
        //       [{"title": "Prénom"},{"title": "Nom"},{"title": "Poste"},{"title": "Date d'arrivée", 'type': 'date-eu'},{"title": "Salaire"}] <-- there is the console.log of "s_dynamicColumns"
        columns: [{"title": "Prénom"},{"title": "Nom"},{"title": "Poste"},{"title": "Date d'arrivée", "type": "date-eu"},{"title": "Salaire"}], // <-- there is the way who works in this example but which is not dynamic at all
        info: false,
        lengthChange: false,
        paging: true,
        searching: true,
        language: {
            url: 'js/dataTables.french.json'
        }
    });

    jQuery.extend(jQuery.fn.dataTableExt.oSort, {
        "date-eu-pre": function (a) {
            var a_euDate = a.split('-');
            return (a_euDate[2] + a_euDate[1] + a_euDate[0]) * 1;
        },

        "date-eu-asc": function (a, b) {
            return ((a < b) ? -1 : ((a > b) ? 1 : 0));
        },

        "date-eu-desc": function (a, b) {
            return ((a < b) ? 1 : ((a > b) ? -1 : 0));
        }
    });
});

Thanks a lot !


Filter the list in a combobox

$
0
0

Hi,
I want to filter the list in a combobox, from a datatable editor. When I use the where condition, I do not have any errors, but it does not return any records.

Editor::inst( $db, 'tb_diccionario' )
->field(
Field::inst( 'tb_diccionario.materia_id' )
->options( Options::inst()
->table( 'tb_materia' )
->value( 'id' )
->label( 'materia' )
->where( 'tb_materia.activo', 1 )
),
Field::inst( 'tb_materia.materia' ),

->leftJoin( 'tb_materia', 'tb_materia.id', '=', 'tb_diccionario.materia_id' )

*Activo es un campo de la tabla materia de tipo tinyint.

Editor AutoFill and KeyTable together Problem

$
0
0

This example is very helpful for me, but when I use this function, I found that when I open up the input element, I try use the autofill ,but It doesn't work。Only I should close the input element first ,I can make the autofill work, so can anyone offer some advice to solve this ? thank you

https://editor.datatables.net/examples/extensions/excel.html

Fixed columns + ScrollY: bug with mousewheel button scroll

$
0
0

Hi there,

Though there have been several threads about rows not scrolling on standard mousewheel scroll, I haven't seen this one documented anywhere.

  1. Goto the basic demo of Fixed Columns:
    https://datatables.net/extensions/fixedcolumns/examples/initialisation/simple.html
  2. Mousewheel-click inside a non-fixed column and start scrolling down.
  3. Maintain mousewheel pressed, then drag over the fixed column.

Problem: the fixed column stops scrolling down! It snaps back in place only when we go back hovering a non-fixed column, or scroll the table vertically in another way (mousewheel or scrollbars).

Seen in the latest versions of Chrome and Firefox (Jan 7, 2019)
Not seen in Internet Explorer 11.

Bug Fixes for _fnCalculateColumnWidths

$
0
0

This bug fix is for tables using the style table-layout: fixed. There is a problem when trying to set discreet column widths if scrollX is true. If a column has content wider than the specified width, the content's width will override the set width. You can see an example here: live.datatables.net/rumomuze/10/edit. As you can see in the example the bottom table which uses a workaround has the columns sized appropriately but columns 2 and 3 in the top table are wider than they have been set. The workaround applied to the bottom table is problematic as it involves the use of scrollXInner which has been deprecated and according to this doc and @allan's comment on this thread should not be used. Not to mention calculation of the appropriate width before initialization of the table can be messy and reduces the dynamic capabilities of the table. While developing a better fix for this I came across a couple related bugs in the _fnCalculateColumnWidths function.

Bug Fix 1

The first bug does not affect the functionality of the main bug I am addressing and I actually have not noticed a manifestation of any problems from this bug in practice (I haven't explicitly looked into it and I think I may have addressed it with some custom css a while back) but the code does not look right. In the section where tmpTable is created and modified there is the following block of code:

// When scrolling (X or Y) we want to set the width of the table as 
// appropriate. However, when not scrolling leave the table width as it
// is. This results in slightly different, but I think correct behaviour
if ( scrollX && scrollXInner ) {
    tmpTable.width( scrollXInner );
}
else if ( scrollX ) {
    tmpTable.css( 'width', 'auto' );
    tmpTable.removeAttr('width');
    
    // If there is no width attribute or style, then allow the table to
    // collapse
    if ( tmpTable.width() < tableContainer.clientWidth && tableWidthAttr ) {
        tmpTable.width( tableContainer.clientWidth );
    }
}
else if ( scrollY ) {
    tmpTable.width( tableContainer.clientWidth );
}
else if ( tableWidthAttr ) {
    tmpTable.width( tableWidthAttr );
}

The if statement that allows a scrollX enabled table to collapse does not seem to match the comment above it. It seems like it should be the following:

// If there is no width attribute or style, then allow the table to
// collapse
if (tmpTable.width() < tableContainer.clientWidth && !tableWidthAttr && !styleWidth) {
    tmpTable.width(tableContainer.clientWidth);
}

I may be misinterpreting the goal of this block of code. If by collapse it is meant that the table should be allowed to be smaller than the tableContainer and only set to the size of the container if there is a width attribute or style then alternatively I would think the code should read:

// If there is no width attribute or style, then allow the table to
// collapse
if (tmpTable.width() < tableContainer.clientWidth && (tableWidthAttr || styleWidth)) {
    tmpTable.width(tableContainer.clientWidth);
}

This, however, necessitates the use of the css width: 100% on a table when scrollX is set to true or you end up with the undesirable formatting shown here (when the page is wide enough): live.datatables.net/rumomuze/11/edit?output. I'm having a hard time wrapping my head around when it would be useful to let a table collapse smaller than the container when using scrollX. It seems to be contrary to the purpose of horizontal scrolling. If someone could provide an example that would be much appreciated and I can tailor the solution accordingly.

Bug Fix 2

The second bug fix is to the setting of the userInputs variable. This fix is necessary to fix the main issue I have described here and may fix additional issues I haven't tested for. It involves the section of code that converts any user input sizes into pixel sizes:

/* Convert any user input sizes into pixel sizes */
for ( i=0 ; i<visibleColumns.length ; i++ ) {
    column = columns[ visibleColumns[i] ];
    
    if ( column.sWidth !== null ) {
        column.sWidth = _fnConvertToWidth( column.sWidthOrig, tableContainer );
    
        userInputs = true;
    }
}

In this block of code if column.sWidth already has a value it is assigned the value of column.sWidthOrig. This seems redundant and since _fnCalculateColumnWidths always sets sWidth at some point this has the consequence that userInputs is always set to true after the first time this function is called even if there were no actual user inputs to the initialization. I believe this if statement is meant to check that column.sWidthOrig is not null:

if ( column.sWidthOrig !== null ) {
    column.sWidth = _fnConvertToWidth( column.sWidthOrig, tableContainer );
    
    userInputs = true;
}

Main Bug Fix

The final change that directly influences the behavior I initially described involves the same block of code as the first bug. If scrollX is set to true and scrollXInner is not set tmpTable has the css width: auto applied. This is problematic as the table will then ignore the specified size on any column that is not wide enough to fit the biggest content in said column. The fix I am using (along with the corrected code to set userInputs in Bug Fix 2) is to only set the width to auto if there is no user specified column sizes as follows:

else if (scrollX) {
    if (!userInputs) {
        tmpTable.css('width', 'auto');
        tmpTable.removeAttr('width');
    }

    // If there is no width attribute or style, then allow the table to
    // collapse
    if (tmpTable.width() < tableContainer.clientWidth && !tableWidthAttr && !styleWidth) {
        tmpTable.width(tableContainer.clientWidth);
    }
}

table.ajax.reload(): how do you JSON.parse?

$
0
0

I am trying to reload my table on the click of a button using table.ajax.reload().
I'm getting an invalid JSON error and upon going through troubleshooting with datatables/tn1, I can see that it is returning html/text instead of JSON.
How do I parse the data on reload?
I've tried various ways of combining table.ajax.reload() with JSON.parse(), but none have worked.

Thanks

Call initComplete on table.ajax.reload()

$
0
0

Due to special layout on my webpage I need to get the "recordsTotal" value in a function when I do a table.ajax.reload()
When I do my initial datatable init I have an initCompletefunction where I can get the value in "settings._iRecordsTotal"

But initComplete is not called on ajax.reload. Is there any way to pass the "settings._iRecordsTotal" value when you do a ajax.reload?

I have tried to do a callback function but can 't get i to work: this.$datatable.DataTable().ajax.reload( function(){ this.totalHitsRender(); alert('COME ON') });
If I could only call my totalHItsRender() function like that....

One-to-many checkboxes in standalone example

$
0
0

I am trying to combine these two examples, https://editor.datatables.net/examples/advanced/joinArray.html and https://editor.datatables.net/examples/standalone/simple.html, to create a standalone editor which uses one-to-many checkboxes.

I understand that when using the standalone editor the additional options data is not loaded so you must load it separately, I have done this and it almost works. All my checkboxes load correctly but the selected checkboxes, i.e the ones which should show a tick, does not work with multiple selected values. So it is the pre-selected values which isn't working for multiple values.

If anyone can point me in the right direction that would be great.

        var editor;  
         
        $(document).ready(function() {
            editor = new $.fn.dataTable.Editor( {
                ajax : {
                    url : "/modules/DataTables/action.run_datatable.php",
                    type : "POST",
                },
                fields: [{
                    label : "Categories:*",
                    name : "system_resource_category[].resource_category_id",
                    type : "checkbox"
                }]
            });    
            editor.on('open', function() {  

                var optionsI = [];
                var optionI = $("span#optionI").attr("data-editor-value");
                $.ajax({
                    type : 'POST',
                    url : '/modules/DataTables/action.run_datatable.php',
                    dataType: 'json',
                    data : { 
                        table: 'system_resource_category',                                                           
                    },
                    success : function(response) {
                        var option = {};
                        $.each(response['data'], function (i, e) {
                            option.label = e.system_resource_category['name'];
                            option.value = e.system_resource_category['resource_category_id'];
                            optionsI.push(option);
                            option = {};
                        });  
                        editor.field('system_resource_category[].resource_category_id').update(optionsI).val(optionI);           
                    } 
                }); 

                editor.on( 'submitSuccess', function ( e, json, data, action ) {
                    var categories = json['data']['0']['system_resource_category'].map(function(entry) { return entry.name; }).join(', ');                    
                    $('[data-editor-field="system_resource_category[].resource_category_id"]').text(categories);
                }); 

            });
            
        });
<tr><td> Categories: </td><td> <span id="optionI" data-editor-field="system_resource_category[].resource_category_id" data-editor-value="8, 7">Hillwalking and Navigation Courses, Winter Courses</span> </td></tr>

Thanks

Chris


Google BigQuery

$
0
0

Hello
Is there a working example of integration with Google BigQuery?

Get current year for search option

$
0
0

I need to get the current year from current date and use it in a column search, some thing like:

var currDate = new Date();
var year = currDate.getFullYear();

    searchCols: [
      null,
      { search: year, escapeRegex: false },
      null,
      null,
      null,
      null,
    ]

but I keep on getting an error "Script error. (line 0)"
Help would by appreciated.

Thanks

Filter column just in time using serverSide

$
0
0

Hi,
I try to implement column filtering without pressing Enter key, but I cant find predefined option for this. I use serverSide processing.
Pressing enter is not comfortable each time.

Can somebody help me ?

thx!

Export to excel first row is coming as filename

$
0
0

I am using this code for export link on grid.

buttons: [{ extend: 'excel', text: 'Export to Excel', filename: 'My Report1' }],

But problem is that, when I am exporting data to excel, First Row has "Index" text appearing,

I want to Remove first cell from excel.

maximum rows in data table

$
0
0

Is there any limit for maximum rows in data table

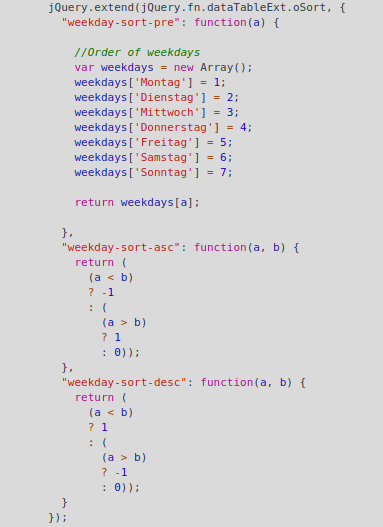
Cannot read property 'oSort' of undefined

$
0
0

I have added a custom sort functionality to my datatable.

and assigned the colum like this
table = jQuery('#table').DataTable({ columnDefs: [{ "type": "weekday-sort", "targets": 2 }],...

It worked smoothly many month, but now suddenly if receive the error message:

I am not aware that I changed any code or so, but obviously something changed.
I tried to use different datatables.min.js files and stuff, but the error keeps persisting.

When I remove the custom sort function the datatable initializes correctly. So something has to have changed, but I have no clue what.

Please help.

Multiple inline editing then one submit

$
0
0

Hi,

Is it possible to have all inline editing saved on client side then all changes can be submitted once using a button ?

Thanks


Date column sorting not working for H24 format

$
0
0

Hello,
I use a simpleDateFormat "yyyy-MM-dd hh:mm:ss.SSS" to display a date in my datatable. I've to change this format to "yyyy-MM-dd HH:mm:ss.SSS" to have the 24H format.
But with this new format, the sort on date column is not working anymore, instead of a sort by date, it is doing an alphabetical sort. Although it was working with the previous format.
It is a matter of plugin I have to use or about code ?

This is my datatable :

$('#dataTables').DataTable({
    responsive: false,
    ajax: {
        "url": restURI + 'orch/search/events/',
        "contentType": "application/json",
        "type": "POST",
        "data": function ( d ) {
            return JSON.stringify(getDatasToSearch());
        },
        error: function(jqXHR, textStatus, errorThrown){
            manageAjaxError(jqXHR, textStatus, errorThrown)
        }
    },
    buttons: [
     'selectAll',
     'selectNone'
     ],
     language: {
         buttons: {
             selectAll: "Select all items",
             selectNone: "Select none"
         }
     },
     select: {
        selector: 'td:first-child',
        style: 'multi'
    },
    order: [0, 'desc'],
    scrollCollapse: true,
    scrollX: false,
    aLengthMenu: [
        [10, 25, 50, 100, -1],
        [10, 25, 50, 100, "All"]
    ],
    iDisplayLength: 25,
    "columns": [
        { "data": "EVENT_ID", "defaultContent": "", "sClass": "text-center limitedWidth" },
        { "data": "FLOW_ID", "defaultContent": "", "sClass": "text-center limitedWidth" },
        { "data": "FLOW_NAME", "defaultContent": "", "sClass": "text-center limitedWidthFlNm" },
        { "data": "OBJECT_TYPE", "defaultContent": "", "sClass": "text-center limitedWidth" },
        { "data": "OBJECT_NAME", "defaultContent": "", "sClass": "text-center limitedWidth" },
        { "data": "OBJECT_VERSION", "defaultContent": "", "sClass": "text-center limitedWidth" },
        { "data": "OBJECT_ITERATION", "defaultContent": "", "sClass": "text-center limitedWidth" },
        { "data": "OPERATION_NAME", "defaultContent": "", "sClass": "text-center limitedWidth" },
        { "data": "OPERATION_STATUS", "defaultContent": "", "sClass": "text-center limitedWidth" },
        { "data": "OPERATION_MESSAGE", "defaultContent": "", "sClass": "text-center limitedWidth" },
        { "data": "CREATE_DATE", "defaultContent": "", "sClass": "text-center limitedWidth","sType":"date" },
        { "data": "UPDATE_DATE", "defaultContent": "", "sClass": "text-center limitedWidth " ,"sType":"date" }
    ]
})

Thank you for your help !

Sort the datatable only of rows with available data not whole table

$
0
0

Iam firing an event to get API on the drawcallback after the datatable got data list. Also what i does that it keep check if current showed page has loaded and if the column data is loaded and column (say A) value is updated, it will sort accordingly by that column . Initially on datatable A column has value of zero.
Below is the code which Iam using for sorting.
let table = $('#comparison-table').DataTable();
let page_order = table.order();
table.order(page_order).draw(false);

My issue is once i click the sorting icon, above code runs again after the order.dt events. So, is there a way to sort by only available data.

json returns nothing after value changed

$
0
0

Hi guys, I have DataTables table with row details which are opening by clicking on row. The row details are displayed in 3 different languages which are selected by checkbox. When the row is clicked, the language is send to details.php script (langy:chLanguage) which returns json values for this selected language.

Initialy the language is set to chDe and everything is working fine until I click on another language. When the language is changed to EN or RU, or even back to DE, the returned json is empty.

Index.php:

<h5>Language</h5>

  <input type="checkbox" id="chDe" name="languages" checked>DE
  <input type="checkbox" id="chEn" name="languages">EN
  <input type="checkbox" id="chRu" name="languages">RU

<script>

var chLanguage = "chDe";
$('input[name=languages]').click(function() {
        $('input[name="' + this.name + '"]').not(this).prop('checked', false);
        chLanguage = [];
        $('input[name=languages]:checked').each(function() {
                chLanguage.push($(this).attr('id'));
        });
        if (chLanguage == '') {
                chLanguage = 5;
        }
        $('#example').DataTable().ajax.reload();
});


function format ( rowData, row, $chLanguage ) {
// FOLLOWING CONSOLE.LOG RETURNS THE ACTUALLY SELECTED LANGUAGE CORRECTLY
        console.log("chLanguage in format function: " + chLanguage);
    var div = $('<div/>')
        .addClass( 'loading slider' )
    $.ajax( {
        url: 'scripts/details.php',
        data: {
            name: rowData[0],
            langy: chLanguage,
        },
        dataType: 'json',
        type: 'post',
        success: function ( json ) {
// FOLLOWING CONSOLE.LOG RETURNS [Object object] unless the language is changed, then it returns nothing
            console.log("json: " + json);
            var childTable = '<div id="rowdetails" class="slidera"><ul class="slider">';
            childTable = childTable.concat(
                '<div class="row rdstyle">' +
                   '<table class="detailstable detailserrors">' +
                      '<tr><td><b>Error class:</b></td><td>' + json[0].ERRTRIEDA + '</td></tr>' +
                      '<tr><td><b>Error group:</b></td><td>' + json[0].ERRSKUPINA + '</td></tr>' +
                      '<tr><td><b>Error:</b></td><td>' + json[0].ERRPOPIS + '</td></tr>' +
                    '</table>' +
                '</div>
  );
 });
}

details.php:

$language = $_POST['langy'];

if ($language == 'chDe' ) {
        $setLang = 'DE';
}else if($language == 'chEn') {
        $setLang = 'EN';
} else{$setLang = 'RU';}

and $setLang is used in SQL query to filter data by language.

I hope I'm not far away from working solution, because it's working already, just the language switch don't work. Sorry not to attach working sample. I don't know how to implement all these parts including mysql db and several differenct php scripts :(
Thank you.

dynamically fit to contents in server-side

$
0
0

My issue comes from the server-side pagination.
Once new data has been injected by ajax source, I need to draw again the table to get the reading fixed because I don't use multiple line per cell. So new contents may be shorter then previous, or longer and the overflow goes on the background than the following cell. It's fine for me, so I just need to redraw using a button that act like a kind of refresh for the table structure:
{ text: 'Refresh', action: function () { table.columns.adjust().draw(); } }
This is just a kind of workaround and it's working, I'm looking for adding this behaviour to the ajax response got from DataTable and I am not able.
If I handle the fnDrawCallback I got infinite refresh that stucks on my web client page, of course it's not a good solution.
By the way, a problem of the main workaround is with the pagination because the button that act like a refresh for the structure of the table brings me back to the first page. If I'm reading contents from the n-th page and I just need to "refresh" tha table I don't get refreshed my current view, so actually there is no way to "refresh" structure for pages that are not the first.

This is my table definition:
table = $("#" + table_name).DataTable({
"processing": true,
"serverSide": true,
"scrollY": '50vh',
"scrollX": true,
"scrollCollapse": true,
"autoWidth": true,
"columnDefs": [
{ "targets": "all", "defaultContent": "-" },
{ "targets": [4,5,6], "createdCell": function (td, cellData, rowData, row, col) {
if ( cellData == 1 ) {
$(td).addClass('compliant');
} else if ( cellData == 0 ) {
$(td).addClass('noncompliant');
}
} },
{ "targets": 3, "createdCell": function (td, cellData, rowData, row, col) {
if ( cellData == 1 ) {
$(td).parent().addClass('top54');
}
} }
],
"columns": [
{ "data": "foo", "className": 'details-control'},
{ "data": "bar" },
{ "data": "bar" },
{ "data": "RowNum", "orderable": false, "visible": false }
],
"ajax": {
"url": "json/ricerca_bdt_ng.php",
"method": "POST",
"data": function (d) {
d.user = account;
d.pass = password;
d.user_ad = account_ad;
d.pass_ad = password_ad;
d.device = deviceid;
d.host = dbhost;
d.port = dbport;
d.db = dbname;
}
},
"language": {
"lengthMenu": "Display _MENU
records per page",
"zeroRecords": "Nothing found - sorry",
//"info": "Showing page PAGE of PAGES",
"infoEmpty": "No records available",
//"infoFiltered": "(filtered from MAX total records)",
"processing": "

",
"searchPlaceholder": "Global"
},

    // Enable datatables.mark.js highlighting
    "mark": true,

    //"select": true,
    "select": {
        style: 'os',
        items: 'cell'
    },

    "dom": "<'fg-toolbar ui-toolbar ui-widget-header ui-helper-clearfix ui-corner-bl ui-corner-br'Blf>rt<'fg-toolbar ui-toolbar ui-widget-header ui-helper-clearfix ui-corner-bl ui-corner-br'ip><'clear'>",
    "buttons": [
        { extend: 'excelHtml5', title: exportfile },
        { extend: 'selectedSingle',
          text: 'Copia cella',
          action: function ( e, dt, node, config ) {
            var sdata = table.cell('.selected').data();
            copyToClipboard(sdata);
          }
        },
        { text: 'Refresh', action: function () { table.columns.adjust().draw(); } }
    ]
    /*"fnDrawCallback": function( oSettings ) {
        console.log( 'DataTables has redrawn the table' );
        table.ajax.reload();
    }*/
});
// fix input placeholder width
table.columns.adjust().draw();
//table.ajax.reload();

This is part of the css I'm using with the table:
/* fix table scrolling out his div /
table{
margin: 0 auto;
width: 100%;
clear: both;
border-collapse: collapse;
table-layout: fixed;
/
word-wrap: break-word;*/
min-width: 100%;
}

th, td { white-space: nowrap; overflow: hidden; }
/th, td { white-space: normal; }/

/* dimensionamento tabella /
/
th { word-break: normal; }
td { word-break: break-all; } */

td.accapo { word-break: normal; }

div.dataTables_wrapper {
width: 95%;
margin: 0 auto;
}

div.dataTables_wrapper div.dataTables_processing {
top: 5%;
}

div.row_details {
width: 950px;
padding: 20px;
}

/* Floating column for labels: 25% width */
.col-25 {
float: left;
width: 25%;
margin-top: 6px;
}

/* Floating column for inputs: 75% width */
.col-75 {
float: left;
width: 75%;
margin-top: 6px;
}

/* Clear floats after the columns */
.row:after {
content: "";
display: table;
clear: both;
}

I'm sorry I am not able to make a working example, I will make treasure of every advice you give me.

json data to be updated in three table and color will change as per data in cell

$
0
0

Hi I have a JSON data which will call via ajax , and the data contained value of three tables . i have to update the table as per some condition ,
as per above data if the first three character is (C2S or C2C or O2C) then accordingly respective table will be update and if the SuccessP value is less (some) 95 then the row will be red or orange .

here is the code which i am trying to call a function with table ID and data and the table is updated but the color condition is not working properly

JSON

[
{
"C2S_KPI":"KO_C2S_T",
"C2S_T_TXN":"9366",
"C2S_S_Count":"9144",
"C2S_SuccessP":"97.62"
},
{
"C2S_KPI":"RB_C2S_T",
"C2S_T_TXN":"17866",
"C2S_S_Count":"17292",
"C2S_SuccessP":"96.78"
},
{
"C2S_KPI":"AS_C2S_T",
"C2S_T_TXN":"3536",
"C2S_S_Count":"3382",
"C2S_SuccessP":"95.64"
},
{
"C2S_KPI":"NE_C2S_T",
"C2S_T_TXN":"966",
"C2S_S_Count":"914",
"C2S_SuccessP":"94.61"
},
{
"C2S_KPI":"BR_C2S_T",
"C2S_T_TXN":"2858",
"C2S_S_Count":"2670",
"C2S_SuccessP":"93.42"
},
{
"C2S_KPI":"OR_C2S_T",
"C2S_T_TXN":"2798",
"C2S_S_Count":"2700",
"C2S_SuccessP":"96.49"
},
{
"C2C_KPI":"KO_C2C_T",
"C2C_T_TXN":"60",
"C2C_S_Count":"57",
"C2C_SuccessP":"95.00"
},
{
"C2C_KPI":"RB_C2C_T",
"C2C_T_TXN":"209",
"C2C_S_Count":"199",
"C2C_SuccessP":"95.21"
},
{
"C2C_KPI":"AS_C2C_T",
"C2C_T_TXN":"41",
"C2C_S_Count":"38",
"C2C_SuccessP":"92.68"
},
{
"C2C_KPI":"NE_C2C_T",
"C2C_T_TXN":"10",
"C2C_S_Count":"9",
"C2C_SuccessP":"90.00"
},
{
"C2C_KPI":"BR_C2C_T",
"C2C_T_TXN":"93",
"C2C_S_Count":"81",
"C2C_SuccessP":"87.09"
},
{
"C2C_KPI":"OR_C2C_T",
"C2C_T_TXN":"86",
"C2C_S_Count":"85",
"C2C_SuccessP":"98.83"
},
{
"O2C_KPI":"KO_O2C_T",
"O2C_T_TXN":"2",
"O2C_S_Count":"2",
"O2C_SuccessP":"100.00"
},
{
"O2C_KPI":"RB_O2C_T",
"O2C_T_TXN":"22",
"O2C_S_Count":"22",
"O2C_SuccessP":"100.00"
},
{
"O2C_KPI":"AS_O2C_T",
"O2C_T_TXN":"4",
"O2C_S_Count":"4",
"O2C_SuccessP":"100.00"
},
{
"O2C_KPI":"NE_O2C_T",
"O2C_T_TXN":"2",
"O2C_S_Count":"2",
"O2C_SuccessP":"100.00"
},
{
"O2C_KPI":"BR_O2C_T",
"O2C_T_TXN":"3",
"O2C_S_Count":"3",
"O2C_SuccessP":"100.00"
},
{
"O2C_KPI":"OR_O2C_T",
"O2C_T_TXN":"1",
"O2C_S_Count":"1",
"O2C_SuccessP":"100.00"
}
]

,

function ltt(myjson,idname) {
 var table = $('#'+idname).DataTable();
     table.destroy();

table = $('#'+idname).DataTable();
    $.each(myjson, function(x, y) {
      var keys = Object.keys(y);
      var rrow = [];
            keys.forEach(function(key) {

                if ( key.substr(0,3) === (idname.substr(6,3))){

                    rrow.push(y[key]);
                    }

                     });

                fLen = rrow.length;
                    for (i = 0; i < fLen; i++) {
                    //console.log('post array'+rrow ); 
                    $('#'+idname).DataTable().row.add(rrow).draw();
                    }

    }   );

    // till here table is updating 


var table = $('#'+idname).DataTable( {

                                "paging":   false,
                                "info":     false,
                                "searching": false,
                                "ordering": true,
                                "bPaginate": false,
                                "scrollX": false,

                            "columns": [
                                    { "data": "KPI" },
                                    { "data": "T_TXN" },
                                    { "data": "S_Count" },
                                    { "data": "SuccessP" }
                                ],

                                "createdRow": function( row, data, index ) {
                                alert(data[3].SuccessP);
                                      if (data[3].SuccessP < 98) {
                                      alert(data[3].SuccessP);
                                        //$('td', row).css('background-color', 'Red');
                                        $(row).addClass("label-warning");
                                      }


                                }   
                            });


}

calling the function

ltt(point,'KEYKPIC2S');

Viewing all 81384 articles
Browse latest View live


<script src="https://jsc.adskeeper.com/r/s/rssing.com.1596347.js" async> </script>