Quantcast
Channel: Recent Discussions — DataTables forums
Viewing all 81691 articles
Browse latest View live

Can I use Column.render multiple times in one table?

$
0
0

I have a table and I want to add a menu on the first column and last one, I'm using the following code and would like to achieve the result in the picture. ATM the front menu on the right (Right Caret) is done via html. I tried using two instances of the code below but it was nor working.

columnDefs: [{ targets: -1, render: function (data, type, row, meta) { return type === 'display' ? '<a href="" class="actionMenu"><img src="./assets/actionMenu.svg"></a>' : '' } }]

Table Picture


Inline editing 4.2 appearing as 4.1999998

$
0
0

Using datatable and Editor (in line) to allow a user to enter sample results.

Numbers such as 4.2 are being stores correctly in MY MSSQL DB but being displayed with a floating point error (I assume). Anywas I've got found the initial display by using ColumnDefs on the Datatable:

        columnDefs: [
          {
              render: $.fn.dataTable.render.number(',', '.', 1),
              targets: [3,4,5,6,7,8]
           }
        ],

which is great, however when I click in the 4.2 Aspergillus in the 2nd row I get:

Is there something similar to the columnDef for the datatable I can use? or is there another solution to get it to be 4.2 instead?

Thank you inadvance for any help given

Scroller & stateSave doesn't work

$
0
0

Hi,

I would like to report that State saving doesn't work with Scroller. After the page refresh Scroller cannot find proper position and stays at the beginning of table.

Steps to reproduce:
1. scroll or scroll-jump to some position in table
2. refresh the page
3. table is blank and scroller at the beginning

You can test it out even at the example page:
https://datatables.net/extensions/scroller/examples/initialisation/state_saving.html

I tried to do some debugging but with no luck. Anyway I found out that state restoring is not triggered because of condition failing: this.s.dt.oLoadedState.iScroller is always undefined.(see image). Maybe it will help.

use two or more tables from database in editor

$
0
0

I use codeigniter to create editor datatables, it was normal for one table, but when i use two tables, there problem in ajax, here is model.

public function getNdsar2020($post)
{
// Build our Editor instance and process the data coming from _POST
Editor::inst( $this->editorDb, 'ndsar2020' )
    ->fields(
        Field::inst( 'no_ndsar' ),
        Field::inst( 'tgl_ndsar' ),
            // ->validator( Validate::dateFormat( 'd/m/y' ) )
            // ->getFormatter( Format::dateSqlToFormat( 'd/m/y' ) )
            // ->setFormatter( Format::dateFormatToSql( 'd/m/y' ) ),
        Field::inst( 'surat' ),
        Field::inst( 'tgl_surat' ),
        Field::inst( 'keterangan' ),
        Field::inst( 'hal' )
    )
    ->process( $_POST )
    ->json();
}

public function getPelanggan2020($post)
{
// Build our Editor instance and process the data coming from _POST
Editor::inst( $this->editorDb, 'pelanggan_2020' )
    ->fields(
        Field::inst( 'nama_pelanggan' ),
        Field::inst( 'idpel' ),
        Field::inst( 'tarif_lama' ),
        Field::inst( 'daya_lama' ),
        Field::inst( 'tarif_baru' ),
        Field::inst( 'daya_baru' ),
        Field::inst( 'jumlah' ),
        Field::inst( 'alamat' ),
        Field::inst( 'daerah_kerja' ),
        Field::inst( 'kontak' )
    )
    ->process( $_POST )
    ->json();
}

}

****and then here my editorlib.****

public function process($post)
{   
    // DataTables PHP library
    require dirname(__FILE__).'/Editor-PHP-1.9.2/lib/DataTables.php';

    //Load the model which will give us our data
    $this->CI->load->model('Sar_model');

    //Pass the database object to the model
    $this->CI->Sar_model->init($db);

    //Let the model produce the data
    $this->CI->Sar_model->getNdsar2020($post);

    //Let the model produce the data
    $this->CI->Sar_model->getPelanggan2020($post);

}

i check the ajax load result with jsonlint, and here is the problem .

Would you give me solution ??

Exporting to CSV "SÃO" and "Há"

$
0
0

Im exporting my data to csv and when there is any special character such as "SÃO" and "Há" the result is
SÃO PAULO and Há
Can you please help me on this?

Thank you in advance

Change background color of first cells of rows

$
0
0

Hello,

I search for rows whose third column value is equal to 'AAA'

var table = $('#jobs-table').DataTable();

        var indexes = table.rows().eq(0).filter(function (rowIdx) {

            return table.cell(rowIdx, 3).data() == 'AAA'? true : false;
        });

then I want to format the first cell with dard background color. But I don't know why. Could you please help? Here is the code to format the whole row that I found on your website. but I cannot use it to format only the first cell of the rows.

table.rows(indexes)
            .nodes()
            .to$()
            .addClass('bg-dark');

Please help

Thank you

Prevent modal from updating datatable

$
0
0

Hello, I have a modal linked in my navigation that has a form inside of it which is interfering with the datatable on the page underneath. I'm not sure if this is a bootstrap modal issue or a dataTables issue, so I am posting here and on stackoverflow for help. As you see in the example below, after clicking on New and opening the modal, when you type in a name and tab off the field, the datatable underneath changes along with your input. How can I stop this from happening?

Example: http://live.datatables.net/tologizu/1/edit?html,output

Scroller doesn't set scrollbar position when table is first drawn

$
0
0

So I'm using scroller with a very large table (>30000 rows) with server side processing.

If I'm in the middle of the table somewhere, and click the reload icon in the browser, It will re-draw the table, and load the data from the position I was before the redraw, as expected.

The problem is that the scrollbar stays at the top, so you cannot see the data that was just loaded as it's way down in the table somewhere. if I click the down arrow at the bottom of the scrollbar, it then loads the next batch of data from the server, and draws it at the top of the table, so now you can see the data, but cannot scroll up, as it's close to the top of the table.

This seems to be a new issue, as it didn't occur until we upgraded to version 2.0.1

The site is behind a firewall, so I can't attach a link.

I tried to use the debugger to upload the configuration information to you, but it appears i'm getting a 500 response from your server.

Thanks,

Jeff


Protect deployed webapp based on editor plugin

$
0
0

Good evening (o;

As I, or my employer are due to soon to buy the editor plugin I would like to ask:

When I deploy a web project to a customer with datatables/editor....
would the customer be able to just copy over the datatable/editor js/css stuff for his own projects?

Or is there any way to protect this besides using ioncube?

thanks in advance
richard

Table not displaying correct answer. What am I doing wrong?

$
0
0

The code for my table is here http://live.datatables.net/jofuhaca/13/edit It runs on my pc but not on the live link, not sure why.
What I am trying to do, is collect api data on a loop and look for a difference in the 'price' object.
The code all runs on my pc except it appears to be calculating and displaying one row out. Console.log shows..

i 0 maintst.js:45:16
L 0.00000249  M 0.00000249  D -0.00000249 maintst.js:46:16
i 1 maintst.js:45:16
L 0.00001957  M 0.00001957  D -0.00001708 maintst.js:46:16
i 2 maintst.js:45:16
L 0.00000062  M 0.00000062  D 0.00001895 maintst.js:46:16
i 3 maintst.js:45:16
L 0.00000584  M 0.00000584  D -0.00000522 maintst.js:46:16
i 4 maintst.js:45:16
L 0.00000001  M 0.00000001  D 0.00000583

i is the counter, L is the lastPrice value M is the current price and D is the difference. What I am after using the first line as an example is for D to equal zero, what is happening is .00000249 is being subtracted from L (or M) 0.00001957 on the next iteration, (i =1) to give -0.00001708 when that too should be zero. I cannot fathom why this is happening. As previously mentioned, I am very new to this so have probably missed something very fundamental.
Thank you for your help

Bootstrap4 DataTable sort and search are not working.

$
0
0

Hello

I am following the instructions https://datatables.net/examples/styling/bootstrap4.html

My table tag is as follows:
**

<

div class="container">

<!-- jQuery first, then Popper.js, then Bootstrap JS -->
<script src="https://cdnjs.cloudflare.com/ajax/libs/popper.js/1.14.7/umd/popper.min.js"
integrity="sha384-UO2eT0CpHqdSJQ6hJty5KVphtPhzWj9WO1clHTMGa3JDZwrnQq4sF86dIHNDz0W1"
crossorigin="anonymous"></script>
<!-- DataTables https://cdn.datatables.net/ -->
<script type="text/javascript" src="https://code.jquery.com/jquery-3.3.1.js"></script>
<script type="text/javascript" src="https://cdn.datatables.net/1.10.20/js/jquery.dataTables.min.js"></script>
<script type="text/javascript" src="https://cdn.datatables.net/1.10.20/js/dataTables.bootstrap4.min.js"></script>

<div>
    <div class="container">
        <div class="row">**

.
.
.

The onload is as follows:

$(document).ready(function () { $('#mytable').DataTable({ paging: false, searching: true, ordering: true, }); });

In the header, I have these tags
<link href="{% static 'custom.css' %}" rel="stylesheet" type="text/css">
<link rel="shortcut icon" href=".{% static "carma.png" %}" type="image/png"/>

<!-- DataTables https://cdn.datatables.net/ -->
<link rel="stylesheet" type="text/css" href="https://cdnjs.cloudflare.com/ajax/libs/twitter-bootstrap/4.1.3/css/bootstrap.css"/>
<link rel="stylesheet" type="text/css" href="https://cdn.datatables.net/1.10.20/css/dataTables.bootstrap4.min.css"/>

The appearance of the table looks fine, but neither the search of the sort functionalities are working. There is no error showing in the Chrome console.

I would appreciate it if someone tells me what else I could be missing.

Thank you

Database updated but not editor

$
0
0

I think I can explain this on the server side, but essentially, the Datatable isn't updated after an edit...at least not immediately. For instance, lets say the original value is 234, and I change it to 235 and save, the value in the data on the datatable shows 234. I then change it to 236 and save, after that, the datatable shows 235.

The server is C#, MVC, with SQL server. I decide to insert a breakpoint in the PreEdit and PostEdit inside of the controller as well as breakpoint in each. Inside the PreEdit, and expanding 'e' I see that the correct number has been submitted, 235.

editor.PreEdit += (sender,e) =>
{
...
}

editor.PostEdit += (sender,e) =>
{
...
}

I set a breakpoint right before the data is returned to the view (which is the Datatable), after resuming the code from PreEdit and it shows the old value of 234 after I scroll to the record I am editing (#1247 - I have quite a few rows. I would have expected it would have grabbed the latest value from the database, which is the one I see in the preedit.

I also view PostEdit and look at the form data (expanding 'sender'), and it is correct as well. Odd, though, in expanding 'e', it shows the first row of the Datatable, not the one being edited.

Another breakpoint, right before the result is returned back to the view shows that the value is still 235. The dataset being sent back, instead of the 1200+ rows, is just the first one.

Anyway, TLDR: The correct information is being sent, to the MVC controller, and the database is being updated, but the old data is being sent back to the view.

Thoughts?

endRender Current Row

$
0
0
                                       , endRender: function (rows, group)
                                                {
                                                    var tQty = rows
                                                        .data()
                                                        .pluck(3)
                                                        .reduce(function (a, b) {
                                                            return a + b.replace(/[^\d]/g, '') * 1;
                                                        }, 0) ;
                                                    var tAcc = rows
                                                        .data()
                                                        .pluck(4)
                                                        .reduce(function (a, b) {
                                                            return a + b * 1;
                                                        }, 0) ;

                                                    var tRej = rows
                                                        .data()
                                                        .pluck(5)
                                                        .reduce(function (a, b) {
                                                            return a + b * 1;
                                                        }, 0);

                                                    var tDiff = rows
                                                        .data()
                                                        .pluck(6)
                                                        .reduce(function (a, b) {
                                                            return a + b * 1;
                                                        }, 0);


                                                    var tYield = 0;
                                                    if (tAcc != 0 && tRej != 0 && tDiff != 0 )
                                                    {
                                                    tYield = tAcc / (tAcc + tRej + tDiff ) * 100;
                                                    tYield = $.fn.dataTable.render.number('', '.', 2, '').display(tYield);
                                                    }


                                                    return $('<tr/>')
                                                        .append('<td colspan="3" align="center" >' + group + '-TOTAL: ' + '</td>')
                                                        .append('<td align="right">' + tQty + '</td>')

                                                        .append('<td align="right">' + tAcc + '</td>')
                                                        .append('<td align="right">' + tRej + '</td>')
                                                        .append('<td align="right">' + tDiff + '</td>')
                                                        .append('<td align="right">' + tYield + '</td>')
                                                }
                                                , dataSrc: [1]

I want to calculate running totals or say some calculations based on grouped rows . i.e first row of the current group and last row of the current group.. how to do it?

How to make search function point to the row without hiding other row?

$
0
0

Hi, I am new to datatables and now currently doing the search function.
Datatables's search will point to the search result and hide the other row.
How can I make the search point to the search result but still containing other line?

I want to make the link transaction to new tab

$
0
0

I made some new Datatables, and I try to make a hyperlink to that.
Here is the code that I wrote.

    var apiInfo = {
        url: staff_list_url,
        method: "GET",
        parameter: "SearchArea",
        aoColumns: [
            {
                sTitle: "CODE", mData: "CODE", sClass: "dt-body-center",
                link: { url: "@Url.Content("~/Staff/Summary")", parameter: ["CODE"] }
            },
            {
                sTitle: "NAME", mData: "NAME",
            },
        ],

if i press the "CODE", I can transfer to the page which is written as @Url.Content (localhost/Staff/Summary)
but It transfer in the same tab, I want to transfer with new tab.

Thanks...


Datatable Ajax SearchParameters

$
0
0

I have a custom made filter function on my website where I am using one of your datatables. When initializing the datatable one can add parameters with the "data" option. I want to do this, but only if search terms are provided. The amount of search terms and their key-value pairs will be known at runtime which is why I can't define them at datatable initialization.

I am basically looking for a possibility to simply add (remove) up to n parameters to (from) the request url:

exampleUrl?draw=1&columns...&key1=value1&...&keyN=valueN&_=1581171459716

I know about the option to add parameters at runtime by using a function for "data", but I didn't understand how to use it in my case. Maybe someone can provide an example of how to do this.

How do customize excel with using datatable in jQuery?

$
0
0

I m using DataTable (Jquery) to export excel file. But I facing on how do put extra information to export excel file. I have tried some code but it didn't meet my expectation.

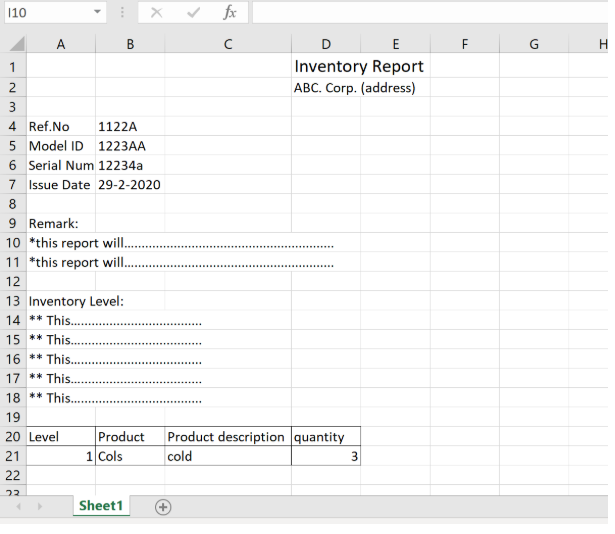
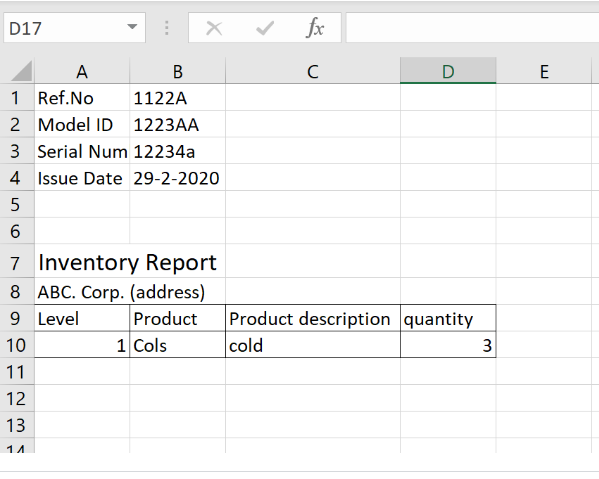
My expected exported excel file is as below picture:

However my output is as below picture, my title report and address is located at middle isn't on top of report:

enter image description here

with using code below:

{
extend: 'excelHtml5',
title: 'Trace Report',
messageTop: 'ABC company' + 'address',
//message: "Any message for header inside the file. I am not able to put message in next row in excel file but you can use \n"+'modelID'+modelId,
render: function (data, type, full, meta) {
return '<a href="' + data + '">Download</a>'; //change the button text here
},
customize: function (xlsx) {

    var sheet = xlsx.xl.worksheets['sheet1.xml'];
    var numrows = 10;

    // add styles for the column header, these row will be moved down
    var clRow = $('row', sheet);

    //$(clRow[0]).find('c').attr('s', 32);

    //update Row
    clRow.each(function () {
        var attr = $(this).attr('r');

        var ind = parseInt(attr);
        ind = ind + numrows;
        //ind is num of row +1
        $(this).attr("r", ind);
    });

    // Create row before data
    $('row c ', sheet).each(function (index) {
        var attr = $(this).attr('r');

        var pre = attr.substring(0, 1);
        //pre=A,B,C..-F repeat 5 time
        var ind = parseInt(attr.substring(1, attr.length));
        ind = ind + numrows;
        $(this).attr("r", pre + ind);
    });

    function addRow(index, data) {
        var row = sheet.createElement('row');

        row.setAttribute("r", index);
        for (i = 0; i < data.length; i++) {
            var key = data[i].k;
            var value = data[i].v;

            var c = sheet.createElement('c');
            c.setAttribute("t", "inlineStr");
            c.setAttribute("s", "2"); /*set specific cell style here*/
            c.setAttribute("r", key + index);

            var is = sheet.createElement('is');
            var t = sheet.createElement('t');
            var text = sheet.createTextNode(value)


            t.appendChild(text);
            is.appendChild(t);
            c.appendChild(is);

            row.appendChild(c);

            debugger;
        }

        return row;
    }

    //add data to extra rows
    var countryStateList = 'asd';
    var agencyValue = 'asd';
    var reportGroupList = 'asd';
    var certNo = '3e'

    var r1 = addRow(1, [{
        k: 'A',
        v: 'Certificate Number'
    }, {
        k: 'B',
        v: 'Model ID:'
    }, {
        k: 'C',
        v: 'Serial Number'
    }, {
        k: 'D',
        v: 'Calibration Date'
    }]);
    var r2 = addRow(2, [{
        k: 'A',
        v: countryStateList
    }, {
        k: 'B',
        v: agencyValue
    }, {
        k: 'C',
        v: reportGroupList
    }, {
        k: 'D',
        v: certNo
    }]); //add one cell for row 1 
    //$('row c[r^="A"]', sheet).attr( 's', '25' );
    var sheetData = sheet.getElementsByTagName('sheetData')[0];
    // sheetData.insertBefore(r4,sheetData.childNodes[0]);
    // sheetData.insertBefore(r3,sheetData.childNodes[0]);
    sheetData.insertBefore(r2, sheetData.childNodes[0]);

    sheetData.insertBefore(r1, sheetData.childNodes[0]);
}

}

Autofill is giving me "Uncaught TypeError: this.node is not a function"

$
0
0

I've been searching these forums but can't seem to find an answer that work for me. I've got the paid version of editor and the code on my table looks like below. I'm trying to get Autofill to work - it shows the blue corner block, I can drag it, but it doesn't update anything and I get the console error Uncaught TypeError: this.node is not a function.

I've seen this error was mentioned in the forums, but nothing seems to help. I've just downloaded the latest package so think everything is up to date.

I hope someone can help.

Thank you!

<table id="prices-table" class="order-column row-border nowrap">
    <thead>
        <tr style="font-size: 14px;">
            <th>Valid From</th>
            <th>Valid To</th>
            <th>Price Name</th>
            <th>Price Per</th>
            @if($product->category->slug == 'accommodation')
                <th>Board</th>
            @endif
            <th>Currency</th>
            <th>Amount</th>
            {{-- <th class="text-right">Order</th> --}}
        </tr>
    </thead>
    <tbody>
    </tbody>
</table>
<script>

var editor;

$(document).ready(function() {

    editor = new $.fn.dataTable.Editor( {
        ajax: '{!! route('app.prices') !!}',
        table: '#prices-table',
        idSrc:  'id',
        fields: [ {
                label: 'Valid From:',
                name: 'valid_from',
                type:  'datetime',
                format:  'YYYY-MM-DD',
            }, {
                label: 'Valid To:',
                name: 'valid_to',
                type:  'datetime',
                format:  'YYYY-MM-DD',
            }, {
                label: 'Name:',
                name: 'name'
            }, {
                label: 'Unit:',
                name: 'unit_id',
                type:  'select',
                options: {'one': 1, 'two': 2, 'three': 3}
            }, {
            @if($product->category->slug == 'accommodation')
                label: 'Board Type:',
                name: 'board_type_id'
            }, { @endif
                label: 'Currency:',
                name: 'currency',
            }, {
                label: 'Amount:',
                name: 'amount'
            }
        ],
    });

    // Activate an inline edit on click of a table cell
    $('#prices-table').on( 'click', 'tbody td', function (e) {
        editor.inline( this, {
            submitOnBlur: true
        });
    });

    var table = $('#prices-table').DataTable({
        dom: 'Bfrtip',
        processing: false,
        serverSide: false,
        fixedHeader: {
            header: true,
        },
        paging: false,
        ajax: '{!! route('app.prices.index', ['product_id' => $product->id]) !!}',
        select: true,
        colReorder: true,
        rowId: 'id',
        columns: [
            {
                data: 'valid_from',
                className: 'dt-body-center',
                render: function (data, type, row) {
                    return data.substring(0, 10);
                },
            },
            {
                data: 'valid_to',
                className: 'dt-body-center',
                render: function (data, type, row) {
                    return data.substring(0, 10);
                },
            },
            {
                data: 'name',
            },
            {
                data: 'unit_id',
                className: 'dt-body-center',
            },
            @if($product->category->slug == 'accommodation')
            {
                data: 'board_type_id',
                className: 'dt-body-center',
            },
            @endif
            {
                data: 'currency',
                className: 'dt-body-center',
            },
            {
                data: 'amount',
                className: 'dt-body-right',
                render: $.fn.dataTable.render.number(',', '.', 0),
            },
        ],
        // editor...
        buttons: [
            { extend: 'create', editor: editor },
            { extend: 'edit',   editor: editor },
            { extend: 'remove', editor: editor },
        ],
        // keys: {
        //     editor: editor,
        // },
        autoFill: {
            horizontal: false,
            vertical: true,
            columns: '', // = all
            editor: editor,
        },
    });

}); // document.ready

</script>
<style type="text/css">
    #prices-table {
        font-size: 14px;
    }
</style>
Landscape Option Not Showing in Google Chrome Print Preview Options

$
0
0

Hi,

I am using datatables on laravel project. When i use print button or ctrl+p, landscape option not showing google chrome print preview. How can i show this option?

Thanks.

Load header based on json file

$
0
0

The json file is over 800 date records. Each date has to be an individual column with its data.

So far, i know that i need to define all columns when using json in order to draw the table.

I am new to this and I cant find a way to dynamic define the columns to draw the table.

Any advice will be much appreciated!

Viewing all 81691 articles
Browse latest View live


<script src="https://jsc.adskeeper.com/r/s/rssing.com.1596347.js" async> </script>