Quantcast
Channel: Recent Discussions — DataTables forums
Viewing all 81691 articles
Browse latest View live

Requested unknown parameter

$
0
0

Can you help me understand why this error comes up?
DataTables warning: table id=list - Requested unknown parameter 'date' for row 0, column 1.

   "columns": [

        {
        "className":      'details-control',
        "orderable":      false,
        "data":           null,
        "defaultContent": '+'
        },  

        {"data": "date"},                              
        {"data": "name"},
        {"data": "lastname"},               
        {"data": "email"},                                              

    ],

The html is also correct. The json response does not give any error. I don't understand this.


Database updated but not editor

$
0
0

I think I can explain this on the server side, but essentially, the Datatable isn't updated after an edit...at least not immediately. For instance, lets say the original value is 234, and I change it to 235 and save, the value in the data on the datatable shows 234. I then change it to 236 and save, after that, the datatable shows 235.

The server is C#, MVC, with SQL server. I decide to insert a breakpoint in the PreEdit and PostEdit inside of the controller as well as breakpoint in each. Inside the PreEdit, and expanding 'e' I see that the correct number has been submitted, 235.

editor.PreEdit += (sender,e) =>
{
...
}

editor.PostEdit += (sender,e) =>
{
...
}

I set a breakpoint right before the data is returned to the view (which is the Datatable), after resuming the code from PreEdit and it shows the old value of 234 after I scroll to the record I am editing (#1247 - I have quite a few rows. I would have expected it would have grabbed the latest value from the database, which is the one I see in the preedit.

I also view PostEdit and look at the form data (expanding 'sender'), and it is correct as well. Odd, though, in expanding 'e', it shows the first row of the Datatable, not the one being edited.

Another breakpoint, right before the result is returned back to the view shows that the value is still 235. The dataset being sent back, instead of the 1200+ rows, is just the first one.

Anyway, TLDR: The correct information is being sent, to the MVC controller, and the database is being updated, but the old data is being sent back to the view.

Thoughts?

can you change message when rows are selected?

$
0
0

At the moment when a user selects rows the message "6 rows selected" is displayed. Is it possible to change this, for example "6 files selected"? Obviously you would need conditional words for singular and plural etc).

Language and Style bug ?

$
0
0

Hello,
I have a little problem. I tried to style my painting as in the following example:

but I have the following result:

Also, I don't have the translation of my code.

   $(document).ready(function () {
    var x = $('#datatable').DataTable({
    language: {
   "url"  : "http://cdn.datatables.net/plug-ins/9dcbecd42ad/i18n/French.json"
    }
    ,
    dom: 'lBfrtip',
    buttons: [
        'excel', 'csv', 'pdf', 'copy'
    ],
    lengthMenu: [10, 25, 50, 100]

    });

    $('.dt-buttons.btn-group').attr('id', 'datatable_button');

    var headerDatatable = $("<div class='row'></div>");
    headerDatatable.append('<div class="col-sm-12 col-md-6"><div class="row"><div class="col-3" id="placeLength"></div> 
    <div class="col-9" id="placeButton"></div></div></div>');
headerDatatable.append($('<div class="col-sm-12 col-md-6"></div>').append($('#datatable_filter')));
$('#datatable_wrapper').append(headerDatatable)
$('#placeLength').append($('#datatable_length'))
$('#placeButton').append($('#datatable_button'))

var bodyDatatable = $("<div class='col-sm-12'></div>");
bodyDatatable = $("<div class='row'></div>").append(bodyDatatable.append($('#datatable')))
$('#datatable_wrapper').append(bodyDatatable)

var footerDatatable = $("<div class='row'></div>");
footerDatatable.append($('#datatable_info'));
footerDatatable.append($('#datatable_paginate'));
$('#datatable_wrapper').append(footerDatatable)
$('#datatable_info').wrap("<div class='col-sm-12 col-md-5'></div>")
$('#datatable_paginate').wrap("<div class='col-sm-12 col-md-7'></div>")
});

Can you help me, please?
Thank you

DataTables responsive multiple fixed header

$
0
0

Hey Guys,

I have a simple table which I get to work with DataTables. I have a multiple fixed header and this is working. The only exception is when in comes to make the table responsive... If you simply delete the multiple header and only have a single fixed header row it's work. But not when you have a multiple fixed header.. Only one of the fixed header rows will be responsive and the other one will not be responsive..

I have followed this code so far: https://datatables.net/extensions/fixedheader/examples/integration/responsive-bootstrap.html

Here you can test my table and code: https://jsbin.com/wicekeyozi/edit?html,js,output

However, I think the responsive solution provided by DataTables and Bootstrap is simply not made for multiple headers.. Is there any way to make it working for multiple headers or does anyone of you has another solution?

Kind regards and Thank You!

Scroller doesn't set scrollbar position when table is first drawn

$
0
0

So I'm using scroller with a very large table (>30000 rows) with server side processing.

If I'm in the middle of the table somewhere, and click the reload icon in the browser, It will re-draw the table, and load the data from the position I was before the redraw, as expected.

The problem is that the scrollbar stays at the top, so you cannot see the data that was just loaded as it's way down in the table somewhere. if I click the down arrow at the bottom of the scrollbar, it then loads the next batch of data from the server, and draws it at the top of the table, so now you can see the data, but cannot scroll up, as it's close to the top of the table.

This seems to be a new issue, as it didn't occur until we upgraded to version 2.0.1

The site is behind a firewall, so I can't attach a link.

I tried to use the debugger to upload the configuration information to you, but it appears i'm getting a 500 response from your server.

Thanks,

Jeff

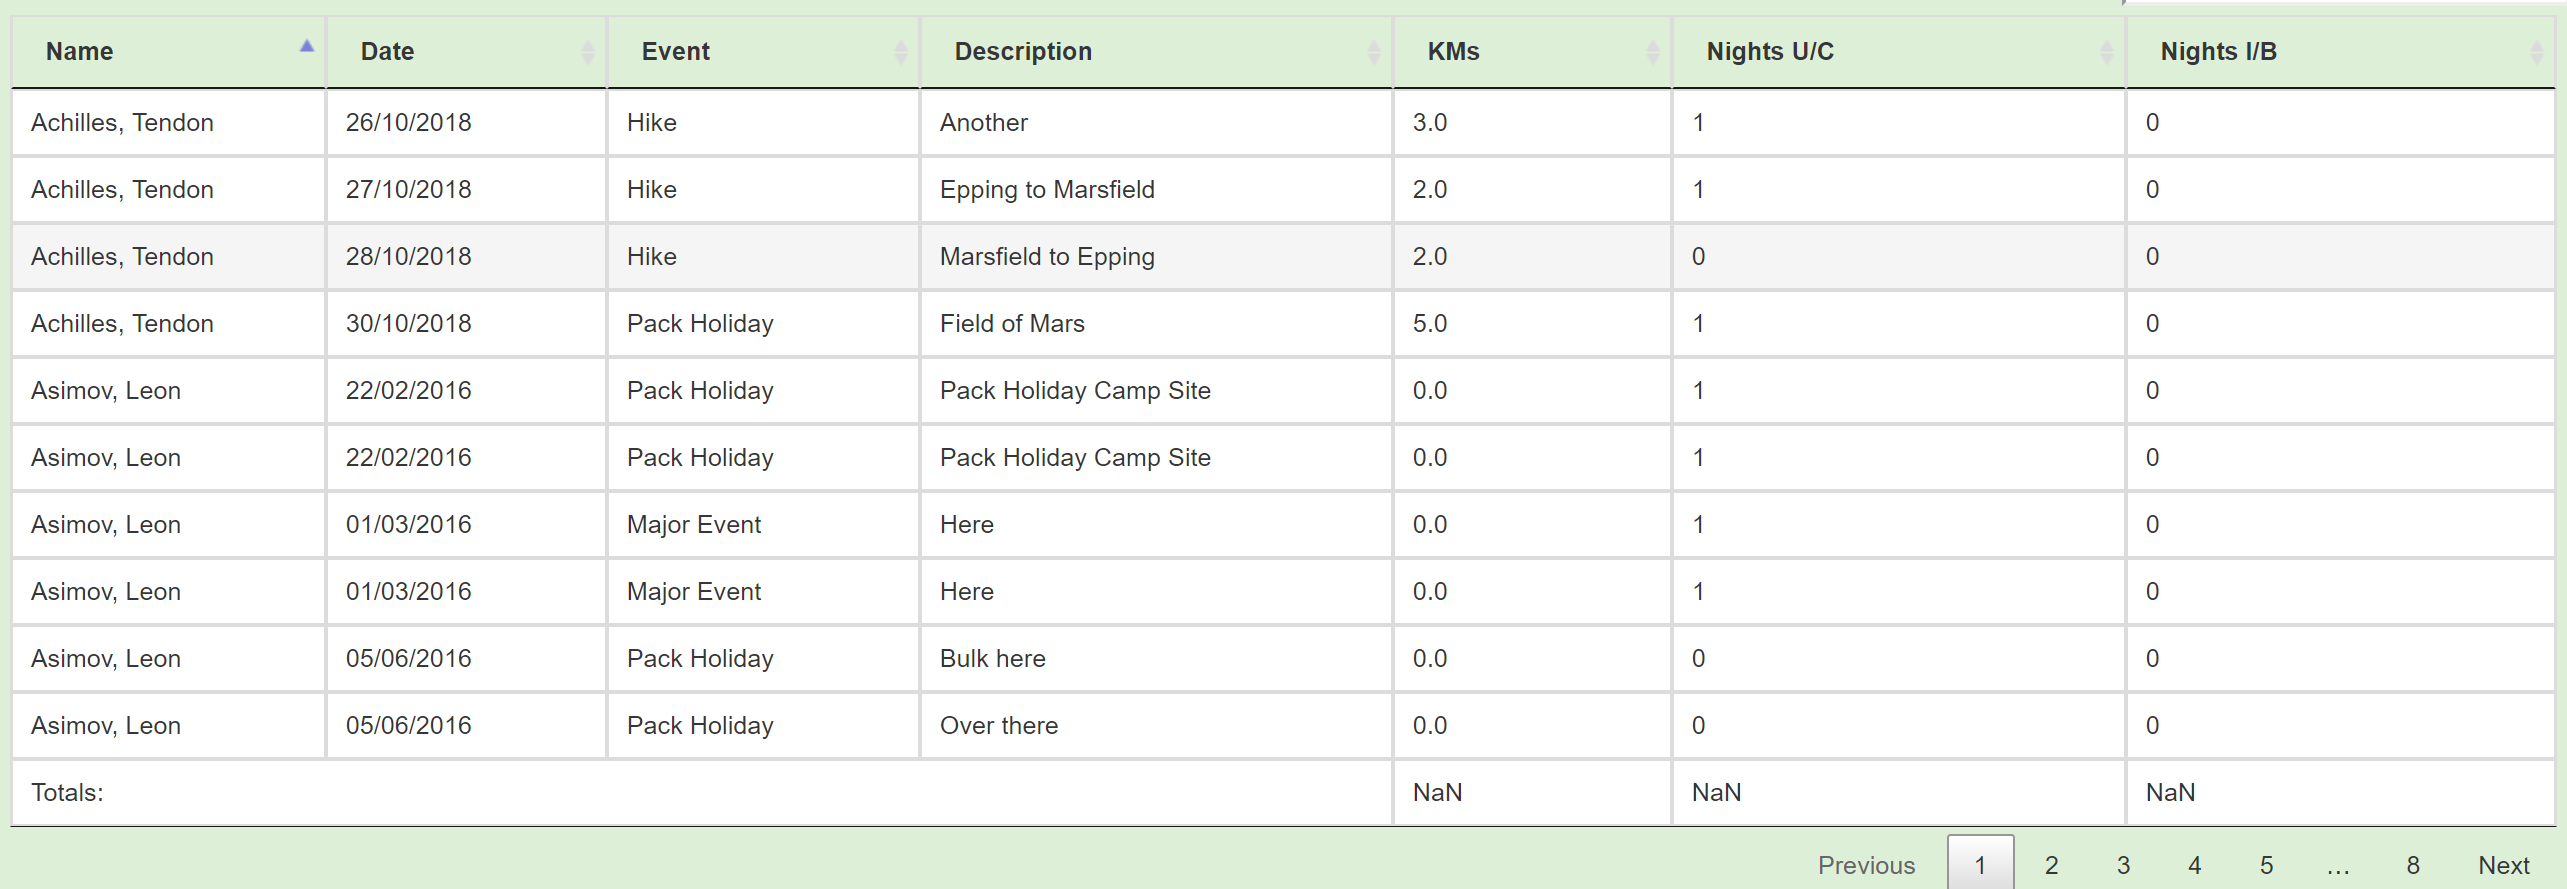
Group totals are at the end of the page instead of after the group and are "NaN".

$
0
0

Hi, I wand to group on the first column and total the last three columns. I used the example provided however the totals appear at the end of the page instead of after the group and are "NaN". Also, is it possible to only provide a total at the end of a group and not when a group finishes at the end of a page (i.e., if a group goes over three pages have one total at the end)?

The code is (I tried with rowGroup first):

 var activityUpdateTable = $('#activityUpdateTable').DataTable( {

        "info":     false,
        dom: 'Bfrtip',
        buttons: ['copy', 'csv', 'excel', 'pdf', 'print'],
        columns: [                  
              { data: null, render: function ( data, type, row ) {
                  // Combine the first and last names into a single table field
                  return data.surname+', '+data.firstname;
              } },
              {data: 'startDate',
                  defaultContent: ""},
              {data: 'type',
                  defaultContent: ""},
              {data: 'description',
                  defaultContent: ""},
              {data: 'kilometres',
                  defaultContent: "0"},
              {data: 'nightsUnderCanvas',
                  defaultContent: "0",
              },
              {data: 'nightsInBuilding',
                  defaultContent: "0",
              },
             ],
         columnDefs: [ {
             targets: [1],
             render: $.fn.dataTable.render.moment( 'DD/MM/YYYY' )
         } ],

         rowGroup: {
            startRender: null,
            endRender: function ( rows, group ) {
                var kmTotal = rows
                    .data()
                    .pluck(4)
                    .reduce( function (a, b) {
                        return a + b*1;
                    }, 0);

                var canvasTotal = rows
                    .data()
                    .pluck(5)
                    .reduce( function (a, b) {
                        return a + b*1;
                    }, 0);

                var buildingTotal = rows
                 .data()
                 .pluck(6)
                 .reduce( function (a, b) {
                     return a + b*1;
                 }, 0);

                return $('<tr/>')
                    .append( '<td colspan="4">Totals:</td>' )
                    .append( '<td>'+kmTotal+'</td>' )
                    .append( '<td>'+canvasTotal+'</td>' )
                    .append( '<td>'+buildingTotal+'</td>' );
            },
            dataSrc: 0
        },
    } );

Just out of curiosity (o;

$
0
0

Good evening

Saw the datatables supporter website here....where people can buy support credits and got mentioned either by name, text link or with a logo and a link...

Just have some thought about it if I should support datatables as well as editor...but....

How come that I see mostly dubios companies mentioned in the file of online casinos, financial and insurance companies?

Would I like to be mentioned with my logo/link in the same league as them?

Just my two cents (o;

cheers
richard


Print button problem in chrome when lots of rows are present (around 2000-4000 rows)

$
0
0

Hi, When clicking the datatable print button (in Chrome) , the new tab opens , the new tab loads for around 5 secs , then the new tab closes automatically. This only happens when lots of rows are present like around 2000-4000 rows and surprisingly this error does not happen when I run it in Incognito mode. Could anyone please help

Parent / Child

$
0
0

Parent / Child

I want to show records of an invoice. And when I click on + in the row I show in a subtable the products of that bill. Both to show the list of invoices and the detail of the invoice must be different AJAX. Pass the invoice ID parameter to the invoice detail to show the products.

I was guided by https://datatables.net/blog/2019-01-11 but I can't get the result mentioned. I'd appreciate your help.

How to parse this nested json

$
0
0

Hi,
I am working on displaying json data in DataTable.
My json looks like this.

    "Results": [
        {
            "DocId": "4842-1398-5949",
            "EnvId": ":Q21:k:p:o:7:~190718162425318.nev|1",
            "DocNum": 1,
            "CustomAttributes": [
                {
                    "Id": 1001,
                    "Value": [
                        "OGC - Admin"
                    ]
                },
                {
                    "Id": 1005,
                    "Value": [
                        "Watch List Project Tracking"
                    ]
                },
                {
                    "Id": 1003,
                    "Value": [
                        "AVR"
                    ]
                },
                {
                    "Id": 1004,
                    "Value": [
                        "Watch List FY20"
                    ]
                },
                {
                    "Id": 6,
                    "Value": [
                        "My Name 1"
                    ]
                },
                {
                    "Id": 5,
                    "Value": [
                        "2019-07-18 20:24:25Z"
                    ]
                },
                {
                    "Id": 8,
                    "Value": [
                        "My Name 1"
                    ]
                },
                {
                    "Id": 7,
                    "Value": [
                        "2020-02-13 20:43:57Z"
                    ]
                },
                {
                    "Id": 11,
                    "Value": [
                        "xlsx"
                    ]
                }
            ]
        },
        {
            "DocId": "4819-9709-4576",
            "EnvId": ":Q19:c:1:j:d:~200109120634702.nev|1",
            "DocNum": 1,
            "CustomAttributes": [
                {
                    "Id": 1001,
                    "Value": [
                        "Research Office"
                    ]
                },
                {
                    "Id": 1005,
                    "Value": [
                        "NIH Inquiry - Sotomayor"
                    ]
                },
                {
                    "Id": 1003,
                    "Value": [
                        "CJO"
                    ]
                },
                {
                    "Id": 1002,
                    "Value": [
                        "Chart/Spreadsheet"
                    ]
                },
                {
                    "Id": 6,
                    "Value": [
                        "My Name 2"
                    ]
                },
                {
                    "Id": 5,
                    "Value": [
                        "2020-01-09 17:06:34Z"
                    ]
                },
                {
                    "Id": 8,
                    "Value": [
                        "My Name 2"
                    ]
                },
                {
                    "Id": 7,
                    "Value": [
                        "2020-02-13 20:28:40Z"
                    ]
                },
                {
                    "Id": 11,
                    "Value": [
                        "docx"
                    ]
                }
            ]
        }
]

I have to display data in CustomAttributes.
Each ID value correspond to a title (which will be table column names) and value will be column value.
I have a list of 11 ids and the result json will have data for any of those 11 ids.
Any pointer on how to go about setting up the table will be really helpful.

There are two types of ordering. Can you add a third method to order?

$
0
0

For both types of ordering there are two icons. And for "sorting_disabled" there is some method to sort in default as "order": []

On Editor entry form, how do I allow a null input?

$
0
0

Code below. for min_amount and max_amount fields, I would like to be able to enter new data or edit data with the option of putting in a number or leaving the field blank or null value.

        {% include "dt_csrf.html" %}

        $('#opex').DataTable(
        );
        $('#otherexp').DataTable(
        );

        let bldg = {{ bldg.id}};
        console.log("bldg" + " " + bldg);

        let editor = new $.fn.dataTable.Editor({
            ajax: "/api/exptiedrev/editor/?format=datatables",
            table: "#exp",
            fields: [
                {
                    label: "Name",
                    name: "name"
                },
                {
                    label: "Type",
                    name: "exp_type",
                    type: "select",
                    options: [
                        {label: "Operating Expense", value: "Operating Expense"},
                        {label: "Other Expenses", value: "Other Expenses"}
                    ],
                    def: "Operating Expense"
                },
                {
                    label: "Revenue Type",
                    name: "rev_type",
                    type: "select",
                    options: [
                        {label: "Base Rent", value: "Base Rent"},
                        {label: "Gross Rent", value: "Gross Rent"}
                    ],
                    def: "Base Rent"
                },
                {
                    label: "Charge Rate %",
                    name: "charge_rate"
                },
                {
                    label: "Min, Charge $",
                    name: "min_amount"
                },
                {
                    label: "Maximum Charge $",
                    name: "max_aumount"
                },

            ],
        });

        editor.on('preSubmit', function (e, data, action) {
            if (action === 'create') {
                data.data[0]['bldg'] = parseInt(bldg);
            }
        });

        // Activate an inline edit on click of a table cell
        $('#exp').on('click', 'tbody td ', function (e) {
            editor.inline(this);
        });

        let table_rev_exp = $('#exp').DataTable({
            "serverSide": true,
            dom: "Bfrtip",
            "ajax": "/api/exptiedrev/?format=datatables&bldg=" + bldg,
            "columns": [
                {"data": "bldg"},
                {"data": "name"},
                {"data": "exp_type"},
                {"data": "rev_type"},
                {
                    "data": "charge_rate",
                    "render": function (data, type, row) {
                        return data + "%";
                    }
                },
                {"data": "min_amount", render: $.fn.dataTable.render.number(',', '.', 2, '$')},
                {"data": "max_amount", render: $.fn.dataTable.render.number(',', '.', 2, '$')},
            ],
            select: true,
            buttons: [
                {extend: "create", editor: editor},
                {extend: "edit", editor: editor},
                {extend: "remove", editor: editor},
                {
                    extend: 'collection',
                    text: 'Export',
                    buttons: [
                        {
                            extend: 'excelHtml5',
                            customize: function (xlsx) {
                                $(xlsx.xl["styles.xml"]).find('numFmt[numFmtId="164"]').attr('formatCode',
                                    '[$$-45C] #,##0.00_-');
                            },
                            exportOptions: {
                                columns: [1, 2, 3, 4, 5, 6],
                            },
                            title: "Expenses"

                        },
                        {
                            extend: 'pdfHtml5',
                            exportOptions: {
                                columns: [1, 2, 3, 4, 5, 6]
                            },
                            title: "Expenses"
                        },
                        {
                            extend: 'print',
                            exportOptions: {
                                columns: [1, 2, 3, 4, 5, 6]
                            },
                            title: " Expenses"
                        },
                    ]
                },
            ],
            "columnDefs": [
                {
                    "targets": [0],
                    "visible": false,
                    "searchable": false
                }
            ],
        });

        table_rev_exp.buttons().container()
            .appendTo($('.col-md-6:eq(0)', table_rev_exp.table().container()));

    });

How to update editor form options for both value and text?

$
0
0

Hello there!

fields = [
{
    label: "Foo Bar"
    name: "FooBar",
    type: "select"
}

I'm looking to update this dropdown dynamically, and am doing it on the on Open event,

editor.on('open', function (e, mode, action) {
   var someOptions = ['1','1','3','4'];
   editor.field('FooBar').update(someOptions);
});

However this produces the options as,

<select name="FooBar" class="form-control valid">
 <option value="1">1</option>
 <option value="1">1</option>
 <option value="3">3</option>
 <option value="4">4</option>
</select>

What I need is the following:

<select name="FooBar" class="form-control valid">
 <option value="a">1</option>
 <option value="b">1</option>
 <option value="c">3</option>
 <option value="d">4</option>
</select>

I did noticed in the documentation for fields().update() I'm able to pass in an object, but didn't see any examples of that.

Would I be able to pass in something similar to below, or is this not yet achievable using the current APIs?

! { "a" : 1, "b" : 1, "c" : 3, "d" : 4 }
or
! [ {"value": 1, "name": "a"}, {"value": 1, "name": "b"}, {"value": 3, "name": "c"}, {"value": 4, "name": "d"} ]?

ckeditorClassic - Configure buttons and add source buuton

$
0
0

I need to change some buttons on ckeditorClassic, and add a source button to edit the source in the editor content. There is a plugin for the editor to add the source button:

https://ckeditor.com/cke4/addon/sourcearea

Any suggestions to achieve this in the datatables editor?


Render Jumpy / table glitchy.

$
0
0

My first datatable. Works ok, but....

I have a datatable populated by a php generated html table so the data is in the DOM for SEO. It builds out the table then jumps down to size, so there is quick noticeable glitch. 400 rows.

Is there a best practice for a smoother render?
I am not strong on front end.

thanks for any ideas.

How do customize excel with using datatable in jQuery?

$
0
0

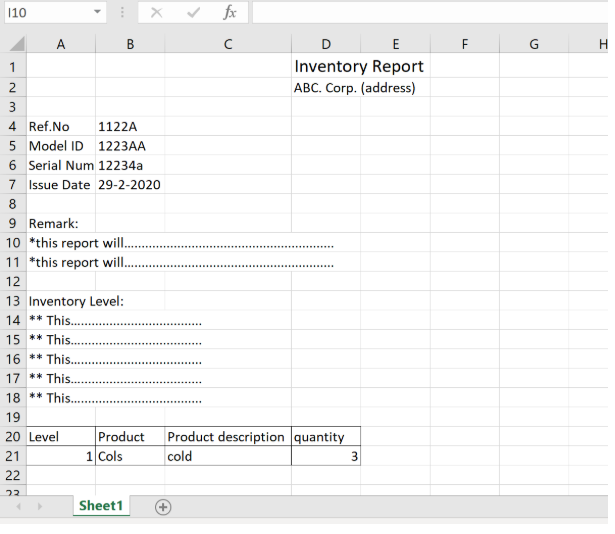
I m using DataTable (Jquery) to export excel file. But I facing on how do put extra information to export excel file. I have tried some code but it didn't meet my expectation.

My expected exported excel file is as below picture:

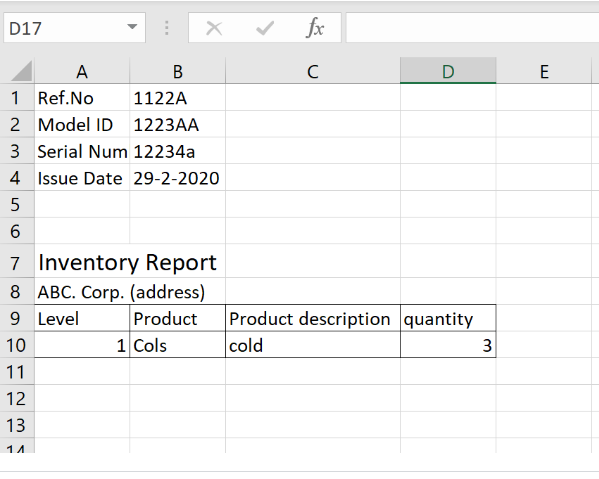
However my output is as below picture, my title report and address is located at middle isn't on top of report:

enter image description here

with using code below:

{
extend: 'excelHtml5',
title: 'Trace Report',
messageTop: 'ABC company' + 'address',
//message: "Any message for header inside the file. I am not able to put message in next row in excel file but you can use \n"+'modelID'+modelId,
render: function (data, type, full, meta) {
return '<a href="' + data + '">Download</a>'; //change the button text here
},
customize: function (xlsx) {

    var sheet = xlsx.xl.worksheets['sheet1.xml'];
    var numrows = 10;

    // add styles for the column header, these row will be moved down
    var clRow = $('row', sheet);

    //$(clRow[0]).find('c').attr('s', 32);

    //update Row
    clRow.each(function () {
        var attr = $(this).attr('r');

        var ind = parseInt(attr);
        ind = ind + numrows;
        //ind is num of row +1
        $(this).attr("r", ind);
    });

    // Create row before data
    $('row c ', sheet).each(function (index) {
        var attr = $(this).attr('r');

        var pre = attr.substring(0, 1);
        //pre=A,B,C..-F repeat 5 time
        var ind = parseInt(attr.substring(1, attr.length));
        ind = ind + numrows;
        $(this).attr("r", pre + ind);
    });

    function addRow(index, data) {
        var row = sheet.createElement('row');

        row.setAttribute("r", index);
        for (i = 0; i < data.length; i++) {
            var key = data[i].k;
            var value = data[i].v;

            var c = sheet.createElement('c');
            c.setAttribute("t", "inlineStr");
            c.setAttribute("s", "2"); /*set specific cell style here*/
            c.setAttribute("r", key + index);

            var is = sheet.createElement('is');
            var t = sheet.createElement('t');
            var text = sheet.createTextNode(value)


            t.appendChild(text);
            is.appendChild(t);
            c.appendChild(is);

            row.appendChild(c);

            debugger;
        }

        return row;
    }

    //add data to extra rows
    var countryStateList = 'asd';
    var agencyValue = 'asd';
    var reportGroupList = 'asd';
    var certNo = '3e'

    var r1 = addRow(1, [{
        k: 'A',
        v: 'Certificate Number'
    }, {
        k: 'B',
        v: 'Model ID:'
    }, {
        k: 'C',
        v: 'Serial Number'
    }, {
        k: 'D',
        v: 'Calibration Date'
    }]);
    var r2 = addRow(2, [{
        k: 'A',
        v: countryStateList
    }, {
        k: 'B',
        v: agencyValue
    }, {
        k: 'C',
        v: reportGroupList
    }, {
        k: 'D',
        v: certNo
    }]); //add one cell for row 1 
    //$('row c[r^="A"]', sheet).attr( 's', '25' );
    var sheetData = sheet.getElementsByTagName('sheetData')[0];
    // sheetData.insertBefore(r4,sheetData.childNodes[0]);
    // sheetData.insertBefore(r3,sheetData.childNodes[0]);
    sheetData.insertBefore(r2, sheetData.childNodes[0]);

    sheetData.insertBefore(r1, sheetData.childNodes[0]);
}

}

Any Export Complete Event?

$
0
0

Hi, I have created a custom action under the buttons for exporting either CSV/Excel files. The export takes quite a bit of time so I have added a loading modal to notify the user - however, I am looking for a way to detect when the export is complete.

If there is some type of event that is fired so I can attach an event listener and have it close the modal once export has completed, that would be great! I have also (unsuccessfully) tried to implement some sort of callback function or promise, however it simply executes the code immediately every time and does not wait for the export to finish.

How to make search function point to the row without hiding other row?

$
0
0

Hi, I am new to datatables and now currently doing the search function.
Datatables's search will point to the search result and hide the other row.
How can I make the search point to the search result but still containing other line?

How to stop initial display of table when page load?

$
0
0

Hi,

I want to stop initial display of data table until a search is executed using Angular Bootstrap I new to coding Angular Bootstrap

Like the picture below

.

Viewing all 81691 articles
Browse latest View live