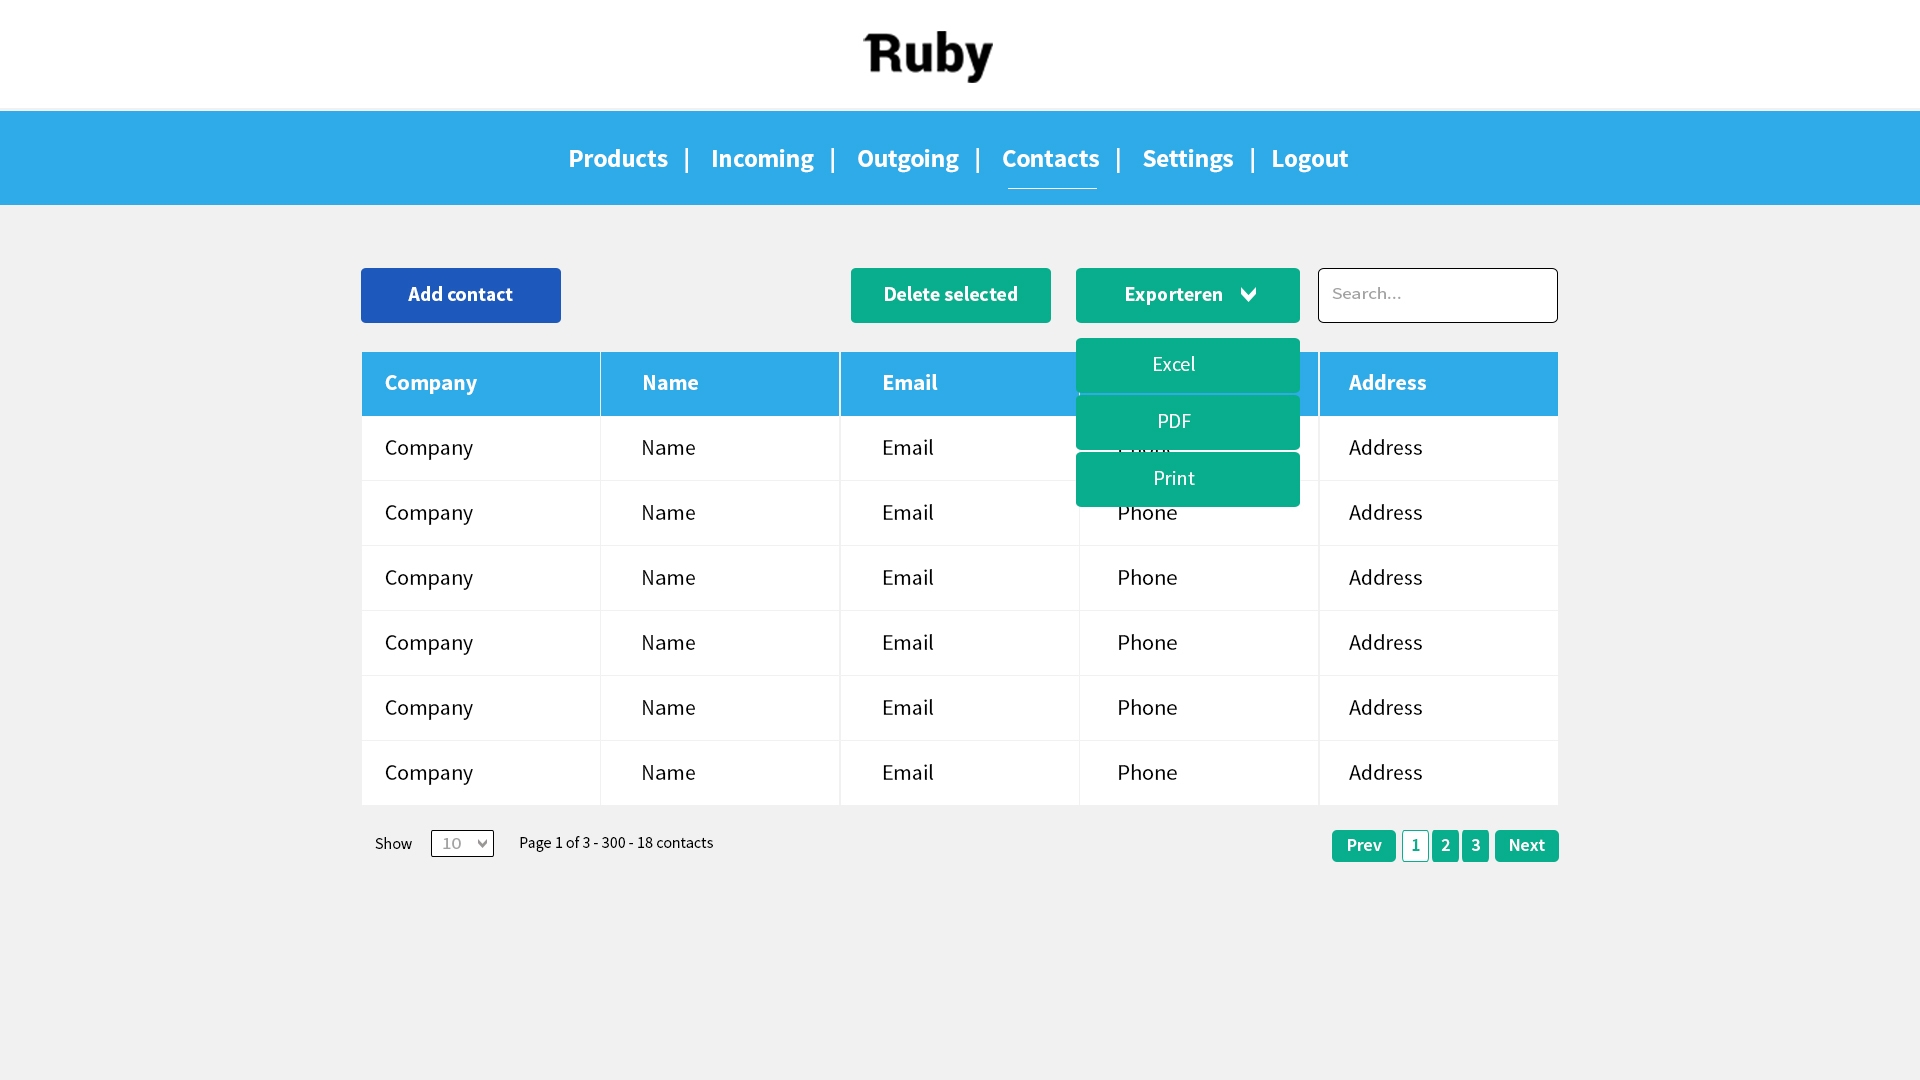
I have some custom buttons. Like Add New, PDF, CSV etc. I want these button in different positions. I have no problem to create button. But how can I give them position like the above image?

I have some custom buttons. Like Add New, PDF, CSV etc. I want these button in different positions. I have no problem to create button. But how can I give them position like the above image?
How do I change align and font style for export title, top message and bottom message? The export title, top message and bottom message keep show in center when I export Excel or PDF file. Here is my code.
buttons: [
       {
              "extend": 'excelHtml5',
              "className": 'btn btn-table-excel',
              "init": function( api, node, config) {
                        $(node).removeClass('dt-button')
              },
              "title": exportTitle,
              "messageTop": exportMessageTop,
              "messageBottom": exportMessageBottom
       }, {
              "extend": 'pdfHtml5',
              "className": 'btn btn-table-pdf',
              "init": function( api, node, config) {
                       $(node).removeClass('dt-button')
              },
              "title": exportTitle,
              "messageTop": exportMessageTop,
              "messageBottom": exportMessageBottom
       }
],
My DataTables version is 1.10.13 and my DataTables Buttons version is 1.6.1
Related question : https://datatables.net/forums/discussion/15947/paging-with-row-grouping
I am using the official RowGroup extension and it generates the extra rows perfectly. However, I want to set a hard limit of 10 rows to the displayed row count but now it displays the number of rows plus the rows generated from the extension. Is there any suggestions on how to display only the number of rows set by displayLength, including the rows generated from RowGroup?
Hi there,
I noticed when accessing this example on ios 13, you can still see the original columns underneath the fixed one
https://datatables.net/extensions/fixedcolumns/examples/initialisation/two_columns.html
I was wondering if there was a way to ensure that when you scroll horizontally and pull right that the original columns don't appear underneath
One way I was thinking was to make the a css style to color the dataTables_scrollBody cells transparent for the columns that correspond to the fixedcolumn ones
Good day! I've been new to using datatables.
I've been trying to search for solutions regarding merging my data to one column with the same identifier
For instance, I have a data of:
Name | Organization
John Doe | Organization A
John Doe | Organization B
and having an expected value of
Name | Organization
John Doe | Organization A, Organization B
Is there a way I can use columns
columns: [
    { data: 'name' },
    { data: 'organization' }
]
for this to work and if so, what should I add for it to work? Thank you
I need to change some buttons on ckeditorClassic, and add a source button to edit the source in the editor content. There is a plugin for the editor to add the source button:
https://ckeditor.com/cke4/addon/sourcearea
Any suggestions to achieve this in the datatables editor?
one admin login having 5 pages of records , when select records of 5th page and logout. then again login to the another admin having only 3 pages of records , but records are not showing in datatable because of bsatesave:true still searching for 5 page record.
need help for above issue
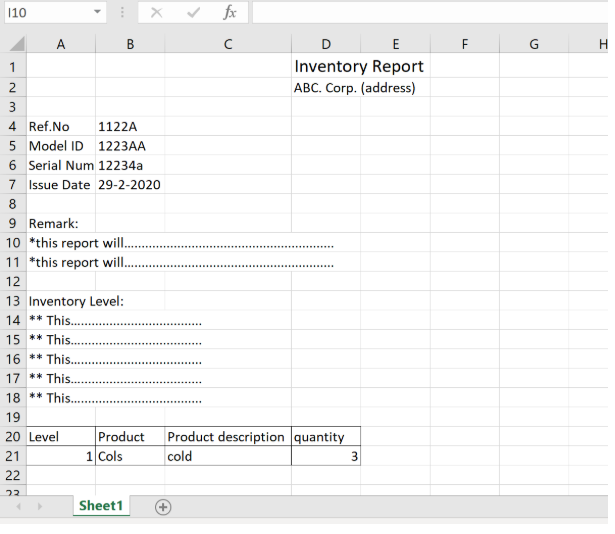
I m using DataTable (Jquery) to export excel file. But I facing on how do put extra information to export excel file. I have tried some code but it didn't meet my expectation.
My expected exported excel file is as below picture:

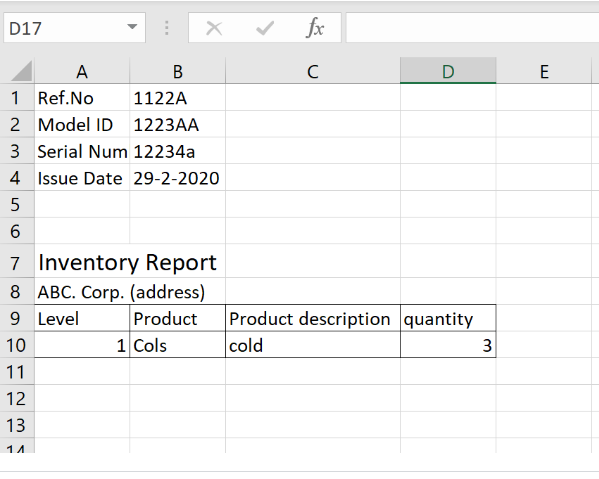
However my output is as below picture, my title report and address is located at middle isn't on top of report:

enter image description here
with using code below:
{
extend: 'excelHtml5',
title: 'Trace Report',
messageTop: 'ABC company' + 'address',
//message: "Any message for header inside the file. I am not able to put message in next row in excel file but you can use \n"+'modelID'+modelId,
render: function (data, type, full, meta) {
return '<a href="' + data + '">Download</a>'; //change the button text here
},
customize: function (xlsx) {
    var sheet = xlsx.xl.worksheets['sheet1.xml'];
    var numrows = 10;

    // add styles for the column header, these row will be moved down
    var clRow = $('row', sheet);

    //$(clRow[0]).find('c').attr('s', 32);

    //update Row
    clRow.each(function () {
        var attr = $(this).attr('r');

        var ind = parseInt(attr);
        ind = ind + numrows;
        //ind is num of row +1
        $(this).attr("r", ind);
    });

    // Create row before data
    $('row c ', sheet).each(function (index) {
        var attr = $(this).attr('r');

        var pre = attr.substring(0, 1);
        //pre=A,B,C..-F repeat 5 time
        var ind = parseInt(attr.substring(1, attr.length));
        ind = ind + numrows;
        $(this).attr("r", pre + ind);
    });

    function addRow(index, data) {
        var row = sheet.createElement('row');

        row.setAttribute("r", index);
        for (i = 0; i < data.length; i++) {
            var key = data[i].k;
            var value = data[i].v;

            var c = sheet.createElement('c');
            c.setAttribute("t", "inlineStr");
            c.setAttribute("s", "2"); /*set specific cell style here*/
            c.setAttribute("r", key + index);

            var is = sheet.createElement('is');
            var t = sheet.createElement('t');
            var text = sheet.createTextNode(value)


            t.appendChild(text);
            is.appendChild(t);
            c.appendChild(is);

            row.appendChild(c);

            debugger;
        }

        return row;
    }

    //add data to extra rows
    var countryStateList = 'asd';
    var agencyValue = 'asd';
    var reportGroupList = 'asd';
    var certNo = '3e'

    var r1 = addRow(1, [{
        k: 'A',
        v: 'Certificate Number'
    }, {
        k: 'B',
        v: 'Model ID:'
    }, {
        k: 'C',
        v: 'Serial Number'
    }, {
        k: 'D',
        v: 'Calibration Date'
    }]);
    var r2 = addRow(2, [{
        k: 'A',
        v: countryStateList
    }, {
        k: 'B',
        v: agencyValue
    }, {
        k: 'C',
        v: reportGroupList
    }, {
        k: 'D',
        v: certNo
    }]); //add one cell for row 1
    //$('row c[r^="A"]', sheet).attr( 's', '25' );
    var sheetData = sheet.getElementsByTagName('sheetData')[0];
    // sheetData.insertBefore(r4,sheetData.childNodes[0]);
    // sheetData.insertBefore(r3,sheetData.childNodes[0]);
    sheetData.insertBefore(r2, sheetData.childNodes[0]);

    sheetData.insertBefore(r1, sheetData.childNodes[0]);
}
}
In my angular project. I have installed npm for datatable buttons (https://www.npmjs.com/package/datatables.net-buttons) and select box (https://www.npmjs.com/package/datatables.net-select). Both got installed successfully but if see npm_modules of these it's showing only js files css files are missing. what i have to do for that. do i need to download and add directly to that or any ways is there. please advise.
When I set up a new DataTable with buttons and then destroy it, I get a JavaScript error. There seems to be a loop in dataTables.buttons.js that removes nodes from the collection it is iterating over. When it gets to the halfway point (e.g. index = 3 for 6 buttons) then that index is no longer valid, because 3 buttons have already been removed from the buttons collection. Here's the simple example - http://live.datatables.net/nebuxani/4/edit
I think I can explain this on the server side, but essentially, the Datatable isn't updated after an edit...at least not immediately. For instance, lets say the original value is 234, and I change it to 235 and save, the value in the data on the datatable shows 234. I then change it to 236 and save, after that, the datatable shows 235.
The server is C#, MVC, with SQL server. I decide to insert a breakpoint in the PreEdit and PostEdit inside of the controller as well as breakpoint in each. Inside the PreEdit, and expanding 'e' I see that the correct number has been submitted, 235.
editor.PreEdit += (sender,e) =>
{
...
}

editor.PostEdit += (sender,e) =>
{
...
}
I set a breakpoint right before the data is returned to the view (which is the Datatable), after resuming the code from PreEdit and it shows the old value of 234 after I scroll to the record I am editing (#1247 - I have quite a few rows. I would have expected it would have grabbed the latest value from the database, which is the one I see in the preedit.
I also view PostEdit and look at the form data (expanding 'sender'), and it is correct as well. Odd, though, in expanding 'e', it shows the first row of the Datatable, not the one being edited.
Another breakpoint, right before the result is returned back to the view shows that the value is still 235. The dataset being sent back, instead of the 1200+ rows, is just the first one.
Anyway, TLDR: The correct information is being sent, to the MVC controller, and the database is being updated, but the old data is being sent back to the view.
Thoughts?
Hi
The 1st editor form uses the standard create, edit and remove extensions but form #2 gets called from a custom button. DT and editor form #1 share the same Ajax method. Form #2 has a different Ajax method that should not refresh the DT as the data it handles is different background data the user can edit but not see directly via the DT. He needs to click the custom button to view and edit that data. The forms handle data across 2 different tables who share the same foreign key.
var editor2 = ModifyCustomerSubPackSNsAssociations_editor();
(DT code)
            buttons: [
                { extend: 'create', editor: editor1 },
                { extend: 'edit', editor: editor1 },
                { extend: 'remove', editor: editor1 },
                {
                    text: '@(lblo.lblAssociatedSNs)',
                    extend: 'edit', editor: editor2
                }
            ],
Code for ModifyCustomerSubPackSNsAssociations_editor:
    function ModifyCustomerSubPackSNsAssociations_editor() {

        var editor = new $.fn.dataTable.Editor({

            destroy: true,
            ajax: {
                url: '/CustomerSubsPacks/CRUDCustomerSubsPacksSNs/',
                data: function ( d ) {
                    return $.extend( {}, d, {
                        intContTpe: intContTpe1
                    } );
                },
                type: 'POST',
                async: true,
                cache: false
            },
            table: '#tblDataTable',
            fields: [
                {
                    label: '',
                    name: 'CustomerSubsPacksSNs.id'
                }, {
                    label: '@(lblo.lblServiceNumbers):',    //cdr formats and price lists don't show ticked when opening editor
                    name: 'CustomerSubsPacksSNs[].id',    //SNs
                    type: "checkbox"
                }
            ]
        });

        return editor;
    }
How do I reference editor2 correctly? The form opens but ajax method CRUDCustomerSubsPacksSNs never gets hit when form opens. Browser console does not throw any errors. Thanks.
Hi, I have created a custom action under the buttons for exporting either CSV/Excel files. The export takes quite a bit of time so I have added a loading modal to notify the user - however, I am looking for a way to detect when the export is complete.
If there is some type of event that is fired so I can attach an event listener and have it close the modal once export has completed, that would be great! I have also (unsuccessfully) tried to implement some sort of callback function or promise, however it simply executes the code immediately every time and does not wait for the export to finish.
Hello,
I am facing an issue concerning the date format within datatable.
I would like to display the data using the format "YYYY-MM-DD" (without hours, minutes and seconds).
Following the example given on this page: https://editor.datatables.net/examples/dates/formatting.html , I used the plug-in Moment.js in order to do it.
It works correctly for the input: when I enter a new data, the form displays the correct format.
Also, when I validate the new entry, the date is displayed using the wanted format.
However, once I refresh the page, the data is displayed in the default ISO 8601 format.
I have searched in the site and forum, but I did not succeed to fix this issue.
Have you got an idea of what I have made wrongly?
Thanks !
this is data
 ],
                    columns       : [
                        {data: 'emp_id'},
                        {data: 'group'},
            {data: 'emp_profile_pic'},
                        {data: 'emp_code'},
                        {data: 'name'},
this is my print window:
$("body").on("click", ".print_qr", function () {
                    var t = table.row($(this).closest('tr')).data();
                    var ttt = '' +
                        '<div style="display:inline-flex;"><img style="display:inline" src="{{ Storage::url("qr-code/") }}' + t['emp_code'] + '.png" style="width:100px;" />' +
                        '<span style="margin-top: 12%;"></span></div>';
                    var newWin = window.open('', 'Print-Window');
                    newWin.document.open();
                    newWin.document.write('<html><body>' + ttt + '<p style="margin-top: 1%; margin-left: 1%;">Name : ' + t['name'] + '</p><p style="margin-top: 1%; margin-left: 1%;">Dept : ' + t['department'] + '</p><p style="margin-top: 1%; margin-left: 1%;"> Contractor : ' + t['contractor'] + '</p>
`<div style="height: 5em; width: 5em;"><p style="width:10% !important; margin-top: 1%; margin-left: 40px;">' + t['emp_profile_pic'] + '</p>`</div></body></html>');
                    //newWin.document.close();
                    newWin.focus();
                    setTimeout(function () {
                        newWin.print();
                      // newWin.close();
                    }, 150);
                });
i tried to increase size of print image(t['emp_profile_pic']) but i couldnt , someone help me out!
Assalamualaikum,
hello i have form update in my website with 15 form input, in ingnited datatable when i set value data-id=$9 still appearing but if i set value more than $9 not appearing values, example i set value $10 then my form appearing with value $10

in my picture i'll try set value $9 be a array , but in my form appearing Array[0]

I never noticed this until I actually needed to sort by a date. All my dates are in USA format (dd/mm/yyyy) but sort as they are strings. From what I read in various forum answers, I was under the impression that DataTables automatically recognized this as a date format. See screenshot for example.

This is all the code I have. Let's say the date column is column 5. How would I force recognition of that column as a date column so that it sorts as a date and not a string?
$(() => {
            $(".display").DataTable({
                dom: 'Bfrtip',
                scrollX:true,
                buttons: [{
                    extend: 'excelHtml5',
                    exportOptions: {
                        columns: [1, 2, 3, 4, 5, 6, 7, 8, 9, 10, 11, 12, 13, 14, 15, 16, 17, 18, 19, 20]
                    }
                }]
            });
        });
When I log in to my WP site as Admin no problem to show the data from DataTable, but if I log in as Subscriber nothing works.
I only get this messages:
DataTables warning: table id=table_1 - Invalid JSON response. For more information about this error, please see http://datatables.net/tn/1
I have tried to understand how to fix it, but can't understand it.
Is there anyone that can give me a hand.....
I want to manipulate the datatable exported excel. is there any way to adjust the width of column to auto so that column width should get adjusted to the length of the bigger string value in that column.
This thread is for feedback of the SearchPane blog post.
SearchPane is currently "experimental", in the sense that it hasn't been released as a full extension for DataTables and all that entails, as I would like to get some early feedback on the software. Is it useful? What is it missing? I'll maintain a list of requests in this post so we don't end up with too many duplicates.
Regards,
Allan
os and multi, etc.)