Hello, I have been trying to get the Vertical & Horizontal scrolling table to work. Vertical it works but not horizontal. Been reading forums with like questions but no luck so far. Vertical scroll, selecting pages, sorting, row clicked all works except x scroll. I am just working with the example and data provided. Have added the the 2 remote files and the jquery-3.3.1.js as well. Any help be appreciated.
↧
scrollX not working
↧
Newbie question; How do I format an API to display data?
I am completely new to this, a hobby for my retirement!.
I have downloaded and have the example datatable running on my local computer. It's just what I need.
Now, I want to change the data source API but when I do, I can't get the data to display in the table.
The only file I have changed is main.js. If I simply change the API, I get a " Loading..." message in the table display and a console error "TypeError: d is undefined". I can see if I load the API's directly and look via the console, that the layout of the two API's is different. The example one is 'neat' whereas the API I want is not.
I have tried all the examples I think will work but to no avail. The only code I can get to display the API via the console is
```var table = $('datatable').DataTable();
$.getJSON("https://tradeogre.com/api/v1/markets", function(data) {
            for (var i=0; i<data.length; i++)
                for (var name in data[i]) {
                console.log("Item name: "+name);
                console.log("Price: "+data[i][name].price);
                console.log("Initial Price: "+data[i][name].initialprice);
            }
        });
});```
But then, I can't get the information to display on the table.
I hope that makes sense. Please can you point me in the right direction.
Thank you
↧
↧
Who can guide me to Extreme Couponing?
Hey, I try to begin with Extreme Couponing
Until now I read that, but Iam still confused: extreme couponing how it works (<A HREF="https://devinxsmm280.kinja.com/the-top-german-coupon-websites-2019-1834862282">Going In this article</A>)
Could someone help medoing so?
↧
Datatables Working on Local Host but when published to Web app get error 404
Hi,
I have an issue when using aspnet.core 2.1, I have datatables controller for my database which connects to the azure hosted sql server database.
This works fine when using IIS Express Localhost however when I publish the project to a web application I get an the following error,
DataTables warning: table id=example - Ajax error. For more information about this error, please see http://datatables.net/tn/7.
The connection string I am trying to use has windows login and I believe this error may be due to the api request (http post and get) as it says the api url cannot be found error 404 or possibly due to the antiforgery token in the ajax request?
↧
Inline Editing Submit onChange instead of onBlur
I have my table nice and happy. Only certain fields are editable inline, they are editable with a drop down select list.
If I edit a field and click off the datatable (or click a non-editable filed) all is ok.
But if I click off a select editable field straight onto another editable select field, then I get this error in the console:
TypeError: g is undefined
To fix it, I thought I could change the line below:
editor.inline( this, {
onChange: 'submit'
} );
To this:
editor.inline( this, {
onChange: 'submit'
} );
But it didnt work. Any ideas or alternative thoughts?
↧
↧
Datatable is not working in mobile browsers
Datatables are working perfectly fine in desktop browsers. When i load that in mobile browsers its not working.
I think its not getting initialised in mobile browsers.
code is as follows:
$('#listing-table').DataTable({
ajax: {
url : '/api/orders',
type : 'POST',
data : {
access_token : window.settings.access_token
},
cache: false
},
columns: [
{ name: 'orders.order_number' },
{ name: 'orders.customer_phone' },
{ name: 'orders.customer_email' },
{ name: 'orders.total_order_amount' },
{ name: 'master_status.label' },
{ name: 'orders.created_at' },
{ name: 'orders.updated_at' },
{ name: 'user_created.fullname' },
],
order: [[ 6, "desc" ]],
columnDefs: [
{ "orderable": false, "targets": [8] },
{
"targets": [3],
"className": 'text-right'
}
]
});
im loading :
↧
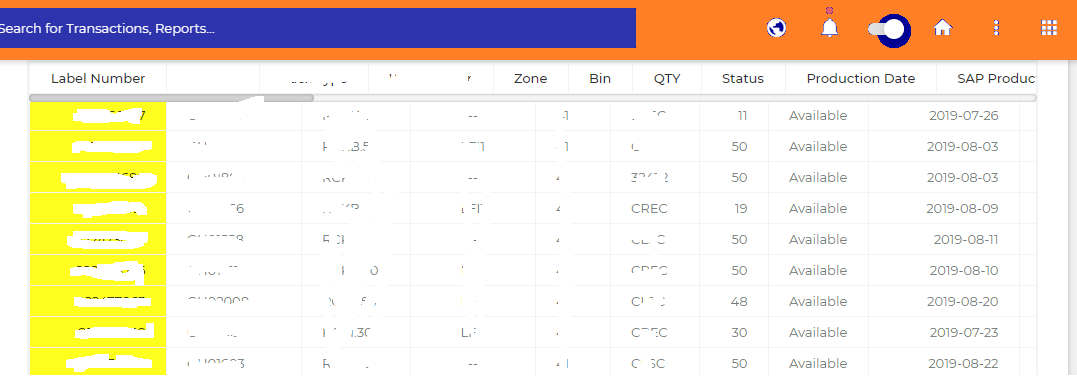
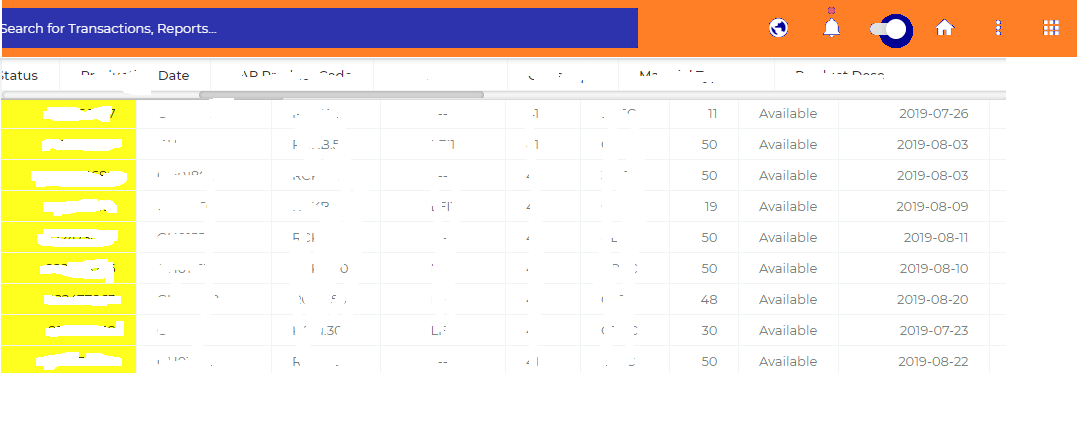
datatables responsive table header issues
when i scroll vertically the header of the table will be fixed under the nav bar.. but the scroll bar will comes. and i scroll horizontally . the tables header only moves. the tbody will not moved.
↧
Server side pagination problem
INTRO
I ran into strange problem: my datatable is showing "Showing 11 to 10 of 10 entries " which is obviously nonsense. I think this could be kind of bug.
I am using PHP server side processing, stateSave: true, resetDisplay: false, processing: true, serverSide: true and some others which I believe are not important.
Let's assume I am showing just some active data, 11 records in total, page length 10 rows => 2 pages withou filter.
When I go to some editation form directly from datatable **second ** page and deactive one record and go back, I am getting message you can see above. AJAX parameters are start:10 and length:10.
Obviously, datatable tries to load / thinks I am still on second page which "doesn't exist" anymore.
The question is how can I handle this. I can handle it on server side like:
if (filteredCount === offset) {
offset = 0;
}
but I am still getting bad message. Thx for your thoughts!
↧
How to tally the number of times a specific value occurs in a dynamically populated column.
I am dynamically populating a column with values using:
{"data": null, //data is null since we want to access ALL data for the sake of our calculation below
                  "render": function(data,type,row) {

                      var today = new Date();
                      var t1 = today.getFullYear() + "-03-31";
                      var end = moment(t1);
                      var start = moment(data.dob);
                      var year = end.diff(start, 'years', true);

                      if(year < 8){
                          return ("J");
                      }else{
                          if(year < 11){
                              return ("C");
                          }else{
                              if(year < 14){
                                  return ("S");
                              }else{
                                  if(year < 18){
                                      return ("V");
                                  }else{
                                      if(year < 26){
                                          return ("R");
                                      }else{
                                          return ("L");
                                      }
                                  }
                              }
                          }
                      }
                  },
              },
I then want to count the number of times "J" occurs using:
var filteredData2 = cubPackDetailsTable
    .column( 8 )
    .data()
    .filter( function ( value, index ) {
        return value == "J" ? true : false;
    } ).count();
    alert("filteredData2: " + filteredData2);
This returns 0 (zero). I have also tried "=" and "===" in place of "==" which return 106 (total number of cells in the column) and 0 (zero) respectively. I have tried to create and example; however, I can not get it to work, at: live.datatables.net/fuhepave/1/edit
Kind regards,
Glyn
↧
↧
Conditional formatting using rowCallback
Hi
I want to color a cell based on it's value. All the sources recommend me to use rowCallback function but for some reason I can't get it working. I'm new to JQuery so maybe there is something really easy I'm missing.
$(document).ready(function() {
    var dt_table = $('#tbl_koond').dataTable({

        language: dt_language,  // global variable defined in html
        aaSorting: [[ 5, "desc" ]],
        lengthMenu: [[25, 50, 100, 200], [25, 50, 100, 200]],
        columnDefs: [
            {orderable: true,
             searchable: true,
             className: "left",
             targets: [0, 1, 2, 3, 4 ,5, 6, 7, 8, 9, 10, 11, 12]
            },
            {
                data: 'foo1',
                targets: [0]
            },
            {
                data: 'foo2',
                targets: [1]
            },
            {   data: 'foo3',
                targets:[2],
                render: function ( data, type, row, meta ) {
                    if(type === 'display'){
                        data = '<a href="http://127.0.0.1:8000/firma/' + encodeURIComponent(data) + '">' + data + '</a>';
                    }

                    return data;
            }
            },
            {
                data: 'foo4',
                targets: [3]
            },
            {
                data: 'foo5',
                targets: [4]
            },
            {
                data: 'foo6',
                targets: [5]
            },
            {
                data: 'foo7',
                targets: [6]
            },
            {
                data: 'foo8',
                targets: [7],
                    render(data){
                        return Number(data).toFixed(0) }
            },
            {
                data: 'foo9',
                targets: [8],
                    render(data){
                        return Number(data).toFixed(0) }

            },
            {
                data: 'foo10',
                targets: [9],
                    render(data){
                        return Number(data).toFixed(0) }

            },
            {
                data: 'foo11',
                targets: [10],
                    render(data){
                        return Number(data).toFixed(0) }
            },
            {
                data: 'foo12',
                targets: [11],
                    render(data){
                        return Number(data).toFixed(0) }
            },
            {
                data: 'foo13',
                targets: [12],
                render(data){
                        return Number(data).toFixed(0) },
            }
        ],

        rowCallback: function (row, data, index) {
            if (data[12] == 100) {
                $("td:eq(12)", row).css('background-color','#99ff9c')
            }
        },

        searching: true,
        processing: true,
        serverSide: true,
        stateSave: true,
        ajax: TESTMODEL_LIST_JSON_URL,


    });
});
↧
$('#myform').serialize() send to server
hi I would like to pass to the server
var $FormData = $('#myform').serialize();
to get the dataset for the table.
better to use: fnServerData o fnServerParams
Thanks.
↧
fieldPlugin and .dependent()
Hi,
I wanted to achieve a toggle button on my form for lookup / manual entry of address data.
I successfully implemented the plugin featured here https://editor.datatables.net/examples/plug-ins/fieldPlugin.html
The toggle button works well.
However 'dependent' does not fire when I reference the plugin field.
    editor.dependent( 'bLookupVsManual', function ( val ) {

        console.log(val)
        return {}

    }, {

        event: 'change'

    } )
I have tried to do a manual change trigger within the plugin click event as follows:
editor.field( 'bLookupVsManual' ).input().trigger('change')
Is there a reason dependent does not work with the plugin?
My workaround is to place the editor.field().show() / editor.field().hide() into the click listener within the plugin code though I think naming specific fields is getting too specific for a plugin so I wondered if dependent could be made to work.
Thanks for any help.
↧
Any decent datatables library?
I had enough of jQuery DataTables. I simply can't stand it's way of getting data from the server and their messy code. Do you guys have any suggestion of a decent datatable library? Specially if it has dependencies handled by bower. And is compatible with Bootstrap!
↧
↧
Bootstrap 3 - Change Sort Icons
Hi, I love the DataTables solution you folks have provided. Thank You!
I have a simple question. I would like to switch the column sort icons in https://datatables.net/examples/styling/bootstrap.html to be like the ones in https://datatables.net/examples/basic_init/zero_configuration.html except I would like them in black rather than purple. I have searched, yet cannot seem to figure it out. Can someone please assist me in this?
Thank you in advance, Timothy
↧
Use custom form without popup
My use case involves the following the following workflow:
- Default view table grid
- Click custom button to edit / add
- On custom button click hide grid, show form (no popup)
- Edit and submit form
- Form hides, grid shows.
Has anyone please got any pointers on how to do this making maximum use of datatables / editor library?
My implementation is Bootstrap4
Any help or comments appreciated
Mike
↧
Hi, I have grouped two column and showing the total price against the grouped column . How can I f
I want to add currency sign and format with two decimal places for the grouped column Please help
rowGroup: {
dataSrc: ["DepotName", "EmpName"], /
startRender: function (rows, group,level) {
                    var total = rows
                        .data()
                        .pluck("Total")
                        .reduce(function (a, b) {
                            return a + b;
                        });

                    return $('<tr/>')
                        .append('<td class="td-left" >' + group + '</td>')   .append('<td></td>')
                         .append('<td></td>')
                         .append('<td></td>')
                         .append('<td></td>')
                         .append('<td></td>')
                         .append('<td></td>')
                         .append('<td style="font-weight:bold;text-align: right;"> </td>')  // How can I add two decimal places in front of the value with currency sign £ against the grouped total column
                    .append('<td style="font-weight:bold">' + total + '</td>');

            }
        },
↧
Any alternatives to DataTables?
I'm working on a new project that needed a spreadsheet type feel of data. In looking for ways to having a "viewport" of the data and keeping heading at top, and all scrolling nicely together, I came acrossIt is great with all that is built in.
Before I dive in too deep, I was wondering if there are any better alternatives, something more modern available with HTML5, or issues people using it have found. I mainly do backend, and doing front end, I dislike, so not wanting to get too far in if it isnt the best option.
Thanks much!
↧
↧
How can I show total salary against each department with currency sign $ and two decimal places
How can I show total salary against each department with currency sign $ and two decimal places for the link I given below from the datatable example. I want to show the salary total against each department please can you help me
https://datatables.net/examples/advanced_init/row_grouping.html
↧
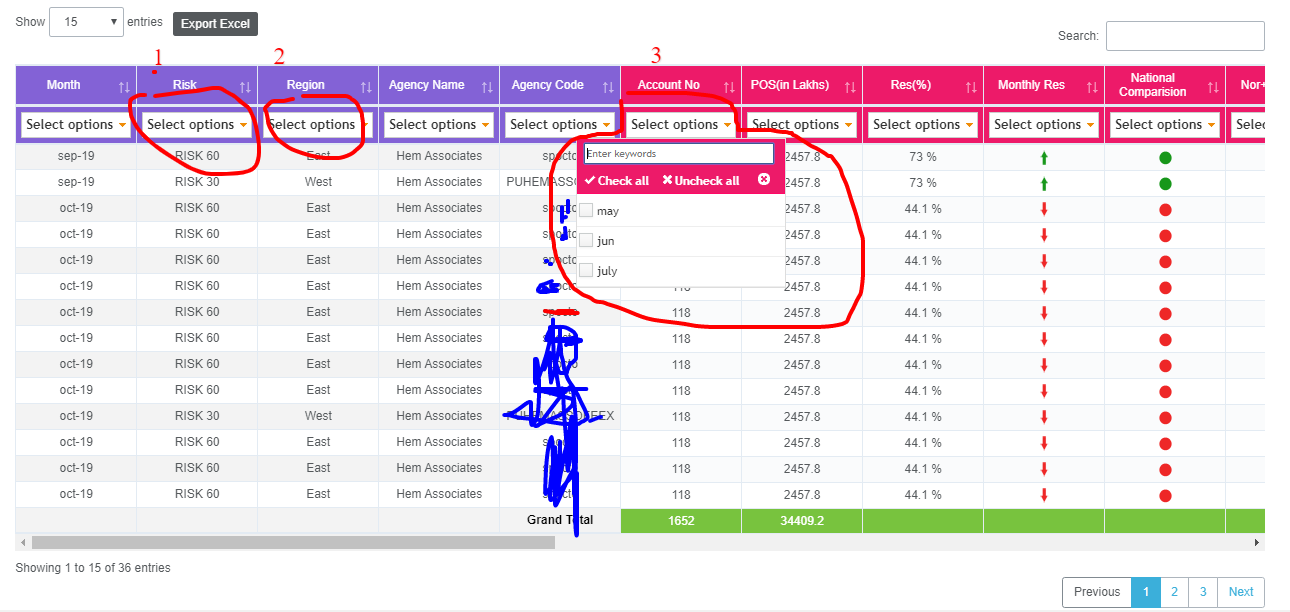
Add Element to absolute header of datatable
I have a datatable with 5 fixed column, I want to add custom filter row in thead section of table.
I am able to add the same perfectly, however due to fixed column, click event to jquery multiselect is binding on the hidden element, and not working on the absolute element as its the clone.
Is there any way I can add elements separately to thead section of class ".DTFC_LeftHeadWrapper" means in the absolute element only not in the hidden after drawing the table.
Below is the screenshot of my datatable, I am able to click on unfreeze column multiselect filter (marked as 3) and not on freeze columns (marked as 1,2)
↧
Best way to access complicated join data in php?
Apologies for the cryptic title, couldn't think of a way to summarise what I'm trying to do.
I have three tables in my database that I want to access here:
* Organisations
* Sites (context: as in physical location, not as in website - has foreign key to Organisations: site_org)
* Users (has foreign key to Organisations: user_org)
I want to get all users with the same organisation key as the site I'm accessing, but I'm only supplying the primary key of the site to the PHP script.
My approach would be to run a separate database query prior to instantiating the dt-editor object and accessing and use the org ID in the inst block, but I'm assuming there's a better way I haven't thought of?..
Thanks in advance,
Dan@Quantum
↧