https://www.linkedin.com/pulse/fortnite-13500-v-bucks-redeem-code-october-2024-free-gift-zvybc
https://www.linkedin.com/pulse/free-unused-roblox-promo-codes-october-2024-all-working-5-minutes-9utpc
https://www.linkedin.com/pulse/fortnite-13500-v-bucks-free-official-redeem-code-october-2024-lqipc
https://www.linkedin.com/pulse/unused-free-roblox-promo-codes-robux-2024-list-latest-working-5ziyc
https://www.linkedin.com/pulse/roblox-free-robux-full-list-gift-card-code-100000-every-player-34dfc
https://www.linkedin.com/pulse/fortnite-free-v-bucks-guide-2024-25-redeem-code-5000-epic-h7nsc
https://www.linkedin.com/pulse/free-roblox-promo-codes-100000-robux-2024-how-get-roblox-us-djlac
https://www.linkedin.com/pulse/fortnite-redeem-codes-5000-v-bucks-list-2024-new-update--i9pzc
https://www.linkedin.com/pulse/roblox-free-robux-full-list-code-lists-2024-get-promo-codes-hll3c
https://www.linkedin.com/pulse/fortnite-redeem-code-13500-v-bucks-epic-games-store-halloween-zmsdc
↧
联合An Epic Games account is required to redeem a V-Bucks
↧
@#$%^Play Roblox Online for Free on PC & Mobile
https://www.linkedin.com/pulse/fortnite-13500-v-bucks-redeem-code-october-2024-free-gift-zvybc
https://www.linkedin.com/pulse/free-unused-roblox-promo-codes-october-2024-all-working-5-minutes-9utpc
https://www.linkedin.com/pulse/fortnite-13500-v-bucks-free-official-redeem-code-october-2024-lqipc
https://www.linkedin.com/pulse/unused-free-roblox-promo-codes-robux-2024-list-latest-working-5ziyc
https://www.linkedin.com/pulse/roblox-free-robux-full-list-gift-card-code-100000-every-player-34dfc
https://www.linkedin.com/pulse/fortnite-free-v-bucks-guide-2024-25-redeem-code-5000-epic-h7nsc
https://www.linkedin.com/pulse/free-roblox-promo-codes-100000-robux-2024-how-get-roblox-us-djlac
https://www.linkedin.com/pulse/fortnite-redeem-codes-5000-v-bucks-list-2024-new-update--i9pzc
https://www.linkedin.com/pulse/roblox-free-robux-full-list-code-lists-2024-get-promo-codes-hll3c
https://www.linkedin.com/pulse/fortnite-redeem-code-13500-v-bucks-epic-games-store-halloween-zmsdc
↧
↧
Changing Language Dynamically on Vue 3
vue version: 3.2.13
datatables.net-dt: 2.1.8
datatables.net-vue3: 3.0.2
I want to change table language at the same instance when an end user change the site's language from navbar.
Below is my template:
<template>
    <div class="keyword_table_wrapper">
        <DataTable
            class="display"
            width="100%"
            :columns="keywordColumns"
            :data="keywords"
            :options="datatableOpts"
            ref="table"
        >
            <thead>
                <tr>
                    <th>ID</th>
                    <th>Anahtar Kelime</th>
                    <th>Oluşturma Tarihi</th>
                    <th>Güncelleme Tarihi</th>
                </tr>
            </thead>
        </DataTable>
    </div>
</template>
Pretty much a simple datatable so far.. Below is my script (I'm using Options API):
import { DataTable } from 'datatables.net-vue3';
import DataTablesLib from 'datatables.net';

DataTable.use(DataTablesLib);

export default {
    components: {
        DataTable
    },
    data() {
        return {
            keywordColumns:[
                { data: "id" },
                { data: "text" },
                { data: "createtime" },
                { data: "updatetime" }
            ],
            keywords: [],
            datatableOpts: {
                language: {
                    url: "https://cdn.datatables.net/plug-ins/2.1.8/i18n/tr.json"
                }
            }
        }
    },
    computed: {
        userLanguage() {
            return this.$store.getters.languageId;
        }
    },
    methods: {
        async loadKeywords() {
                //loading table data stuff..
            }
        }
    },
    watch: {
        userLanguage(newVal, oldVal) {
            if (newVal && newVal != oldVal) {
                const dt = this.$refs.table;

                if (newVal == "tr") {
                    this.datatableOpts.language = "https://cdn.datatables.net/plug-ins/2.1.8/i18n/tr.json";
                    dt.dt.draw();
                    dt.dt.init();
                } else if (newVal == "en") {
                    this.datatableOpts.language = "https://cdn.datatables.net/plug-ins/2.1.8/i18n/en-GB.json";
                    dt.dt.draw();
                    dt.dt.init();
                } else if (newVal == "ar") {
                    this.datatableOpts.language = "https://cdn.datatables.net/plug-ins/2.1.8/i18n/ar.json";
                    dt.dt.draw();
                    dt.dt.init();
                } else {
                    this.datatableOpts.language = "https://cdn.datatables.net/plug-ins/2.1.8/i18n/tr.json";
                    dt.dt.draw();
                    dt.dt.init();
                }
            }
        }
    },
    async created() {
        await this.loadKeywords();
    }
}
I can guarantee that my userLanguage computed value is working fine. I'm not sharing its under the hood codes as it will make off-topic content.
When userLanguage watcher triggered datatable lang remains as the same on its initial value. I think I have to re-render the table somehow but couldn't find how from the docs. Those .draw() and .init() funcs don't make any difference.
Anyone has an idea?
Thank you in advance.
↧
Searching in a datatable and setting columns
Hello, I have a question about searching. Loading data from mysgl into Datatable works for me. The table has a total of 5 columns. If I search for a term, an error message pops up. When I remove two columns and the table contains 3 columns the search works. Where the number of columns in the table is set. Or where can the error be? The table contains Czech data. Thank you for your help.
SKRIPT
<?php
/* Database connection start */
$servername = " ****** ";
$username = " ****** ";
$password = " ****** ";
$dbname = " ****** ";
$conn = mysqli_connect($servername, $username, $password, $dbname) or die("Connection failed: " . mysqli_connect_error());
mysqli_set_charset($conn,"utf8");
// storing request (ie, get/post) global array to a variable
$requestData= $_REQUEST;
$columns = array(
0 => 'datum',
1 => 'cas',
2 => 'poradatel',
3 => 'misto',
4 => 'akce'
);
// getting total number records without any search
$sql = "SELECT id, datum, cas, poradatel, misto, akce ";
$sql.=" FROM FOTOAS_akce2 ";
$query=mysqli_query($conn, $sql) or die("data-songs.php: NACTENI MYSGL TABULKY RZH-SONGS-MY DO DATATABLE");
$totalData = mysqli_num_rows($query);
$totalFiltered = $totalData; // when there is no search parameter then total number rows = total number filtered rows.
$sql = "SELECT id, datum, cas, poradatel, misto, akce ";
$sql.=" FROM FOTOAS_akce2 WHERE 1=1";
if( !empty($requestData['search']['value']) )
{
$sql.=" AND ( datum LIKE '".$requestData['search']['value']."%' ";
$sql.=" OR cas LIKE '".$requestData['search']['value']."%' ";
$sql.=" OR poradatel LIKE '".$requestData['search']['value']."%' ";
$sql.=" OR misto LIKE '".$requestData['search']['value']."%' ";
$sql.=" OR akce LIKE '".$requestData['search']['value']."%' )";
}
$query=mysqli_query($conn, $sql) or die("data-objednavky.php: NACTENI MYSGL TABULKY ESHOP-OBJEDNAVKY DO DATATABLE");
$totalFiltered = mysqli_num_rows($query); // when there is a search parameter then we have to modify total number filtered rows as per search result.
$sql.=" ORDER BY ". $columns[$requestData['order'][0]['column']]." ".$requestData['order'][0]['dir']." LIMIT ".$requestData['start']." ,".$requestData['length']." ";
/* $requestData['order'][0]['column'] contains colmun index, $requestData['order'][0]['dir'] contains order such as asc/desc */
$query=mysqli_query($conn, $sql) or die("data-objednavky.php: NACTENI MYSGL TABULKY ESHOP-OBJEDNAVKY DO DATATABLE");
$data = array();
while( $row=mysqli_fetch_array($query) )
{
$nestedData=array();
$nestedData[] = $row["datum"];
$nestedData[] = $row["cas"];
$nestedData[] = $row["poradatel"];
$nestedData[] = $row["misto"];
$nestedData[] = $row["akce"];
$nestedData[] = '<button class="btn btn-sm btn-success modal-eshop-edit" id="'.$row["id"].'" data-toggle="modal" data-target="#modal-eshop-edit" title="Editace"><i class="fa fa-edit" aria-hidden="true"></i></button>
<button class="btn btn-sm btn-danger" data-toggle="modal" data-target="#modal-eshop-delete" data-whatever="'.$row["id"].'" title="Smazat"><i class="fa fa-trash-o" aria-hidden="true"></i></button>';
$data[] = $nestedData;
}
$json_data = array(
"draw" => intval( $requestData['draw'] ), // for every request/draw by clientside , they send a number as a parameter, when they recieve a response/data they first check the draw number, so we are sending same number in draw.
"recordsTotal" => intval( $totalData ), // total number of records
"recordsFiltered" => intval( $totalFiltered ), // total number of records after searching, if there is no searching then totalFiltered = totalData
"data" => $data // total data array
);
echo json_encode($json_data); // send data as json format
<?php > ?>↧
Problem with searchPanes Filtering Options
Link to test case:
https://live.datatables.net/sebeheco/1/edit
I use the example "Custom Filtering Options" with values modified to my output.
But my example gives me a different output:
Column 11( Prämie ) is not displayed
The same searchPanes are displayed for columns 4 and 5
Did I forget something or do something wrong?
If so, can you give me the correct entries?
Thanks for your help
↧
↧
Datatables warning table id= lorTable - requested unknown parameter id for row 0, column 0 help
I am displaying all the records on a page and it's got all the data showing but the id number is missing and I get the error Datatables warning table id= lorTable - requested unknown parameter id for row 0, column 0 showing on the page and I click OK and it shows the page with the data but the id column value is missing but the rest of the data is displayed
The code I have is below
lorries.php page
| id | Lorry Name | Lorry Area | Lorry Day | action |
|---|
assets/js/custom.js file
$("#lorTable").DataTable({
processing: !0,
serverSide: !0,
serverMethod: "post",
ajax: { url: "app/ajax/lorry_data.php" },
columns: [{ data: "id" }, { data: "lorryname" }, { data: "lorryarea" }, { data: "lorryday" }, { data: "action" }],
}),
I'm new to dataTables, if I need to provide more info or debug, let me know please but I'm not sure how to debug dataTables etc
↧
How to reinitialize DT after updating DOM
The DOM and datatable initialized correctly but when updating DOM with new record pushed to the main array "items" or when updating the DT destroyed but not initialized again
<DataTable id="tableId" :options="dt_options" class="display nowrap" width="100%">
                    <thead>
                        <tr>
                            <th class="text-uppercase text-secondary text-xs font-weight-bolder opacity-7">name</th>
                            <th class="no-sort text-secondary opacity-7">actions</th>
                        </tr>
                    </thead>
                    <tbody>
                        <tr v-for="(branch, index) in items" :key="branch.id" >
                            <td>
                                <div class="d-flex px-2 py-1">
                                    <div class="d-flex flex-column justify-content-center">
                                        <h6 class="mb-0 text-sm" dir="ltr">{{branch.name}}</h6>
                                    </div>
                                </div>
                            </td>
                            <td>
                                <div class="align-content-start float-start" style="margin-left: 60px">
                                    <button type="button" class="btn-glass" @click.prevent="startUpdating(branch)">
                                        <font-awesome-icon icon="pen-to-square" style="color: orange" size="xl" data-toggle="tooltip" title="edit branch"/>
                                    </button>
                                </div>
                            </td>
                        </tr>
                    </tbody>
                </DataTable>
            </div>
        </div>
    </div>
</template>

<script>
import DataTable from "datatables.net-vue3";
export default {
    name: "Branches",
    props: ['branches'],
    components: {DataTable},
    created() {
        this.items = this.branches;
    },
    data() {
        return {
            items: [],
            editedItemIndex: null,
            dt_options: {
                select: false,
                responsive: true,
                lengthMenu: [5, 10, 25, 50],
                columnDefs: [
                    {
                        targets: 'no-sort',
                        orderable: false,
                    }
                ]
            }
        };
    },
    mounted() {
        this.freshDataTable();
    },
    beforeUpdate() {
        this.refreshDataTable();
    },
    methods: {
        push(newItem) {
            this.items.unshift(newItem);
        },
        update(newUpdatedItem) {
            if (this.editedItemIndex !== null) {
                this.items.splice(this.editedItemIndex, 1, newUpdatedItem);
                this.editedItemIndex = null;
            }
        },
        clean(index) {
            this.items.splice(index, 1);
        },
        freshDataTable() {
            this.$nextTick(() => {
                const table = $('#tableId');
                if (!$.fn.dataTable.isDataTable(table)) {
                    table.DataTable(this.dt_options);
                }
            });
        },
        destroyDataTable() {
            const table = $('#tableId');
            if ($.fn.dataTable.isDataTable(table)) {
                table.DataTable().clear();
                table.DataTable().destroy(true); // Pass true to remove the table from the DOM
            }
        },
        refreshDataTable() {
            this.destroyDataTable();
            this.freshDataTable();
        }
    }
};
</script>
↧
Datatable 2.0 and responsive: Cannot read properties of null (reading '_details')
Link to test case: https://live.datatables.net/wuraxuci/7/edit
Error messages shown:
VM1902 dataTables.js:8076 Uncaught TypeError: Cannot read properties of null (reading '_details')
at HTMLTableElement.<anonymous> (VM1902 dataTables.js:8076:15)
at HTMLTableElement.dispatch (VM1900 jquery-3.7.1.min.js:2:40035)
at v.handle (VM1900 jquery-3.7.1.min.js:2:38006)
at Object.trigger (VM1900 jquery-3.7.1.min.js:2:70124)
at ce.fn.init.triggerHandler (VM1900 jquery-3.7.1.min.js:2:70811)
at _fnCallbackFire (VM1902 dataTables.js:6273:50)
at _fnAdjustColumnSizing (VM1902 dataTables.js:2140:3)
at _Api.<anonymous> (VM1902 dataTables.js:8552:4)
at _Api.iterator (VM1902 dataTables.js:6672:15)
at _Api.<anonymous> (VM1902 dataTables.js:8551:15)
Description of problem: this stopped working after updating to 2.0. Basically i have 2 tables. Each row ends with a + button. If the user clicks on it the item gets moved to table 2. If the table is fully opened it works fine but if you resize the window and click on the button you get the above error in console.
I use a function to get the row
function getDatatableTriggeredRow(trigger_el) {
if (trigger_el.closest('li').length) {
return trigger_el.closest('tr').prev('tr');
} else {
return trigger_el.parents('tr');
}
}
and it works fine in every page i use it except for this particular case.
↧
Datatables.net-react library returning [object HTMLDivElement] instead of actual HTML when printing?
Description of problem:
Component code:
import 'datatables.net-dt/css/dataTables.dataTables.min.css';
import DataTable from 'datatables.net-react';
import DT from 'datatables.net-dt';
import "datatables.net-buttons/js/buttons.colVis";
import "datatables.net-buttons/js/buttons.html5";
import "datatables.net-buttons/js/buttons.print";
import "datatables.net-buttons/js/dataTables.buttons";
import jszip from 'jszip';
import pdfmake from 'pdfmake';

DataTable.use(DT);
DT.Buttons.jszip(jszip);
DT.Buttons.pdfMake(pdfmake);

const DataTable3 = (prop) => {
    const {columns, data, slots, options} = prop
    return (
        <DataTable
          columns={columns}
          data={data}
          slots={slots}
          options={{
            layout: {
              topStart: {
                buttons: ['pdfHtml5', 'csvHtml5', 'print', 'colvis'],
              },
            },
            paging: true,
            searching: true,
            ordering: true,

            ...options, // Override with custom options
          }}
          className="display"
          style={{ width: '100%' }}
        />
      );
};

export default DataTable3;
Table code:
  const [columnsSupervisorTypeForDataTable, setColumnsSupervisorTypeForDataTable] = useState([
    {title : 'S#', data : 'serialNumber'},
    {title : 'Title', data : 'title'},
    {title : 'Description', data : 'description'},
    {title : 'Status', data : 'status'},
    {title : 'Action', data : 'action'}
  ])

  useEffect(() => {
    const newData = supervisorTypesList?.map((stl, index) => ({
      serialNumber: index + 1,
      title: stl?.title,
      description: parseDescriptionText(stl?.description),
      status: {id: stl?.id, is_active: stl?.is_active},
      action: {id: stl?.id},
    }));

    setDataSupervisorTypeForDataTable(newData || []);
  }, [supervisorTypesList]);

  const [slotsSupervisorTypeForDataTable, setSlotsSupervisorTypeForDataTable] = useState({
    3: (data, row) => {
      return <FormGroup switch>
        <Input
          type="switch"
          data-size="small"
          data-color="#00c292"
          data-switchery="true"
          style={{ cursor: 'pointer' }}
          checked={data?.is_active}
          onClick={() => toggleIsActive(data?.id, data?.is_active)}
        />
      </FormGroup>;
    },
    4: (data, row) => {
      return   <div className="text-nowrap col-1" style={{ position: 'relative' }}>
      <a
        data-toggle="modal"
        data-target="#Edit-modal"
        data-original-title="Edit"
        onMouseEnter={() =>
          setHoveredAction({ action: 'edit', id: data?.id })
        }
        onMouseLeave={() => setHoveredAction({ action: '', id: null })}
        onClick={() => setHoveredAction({ action: '', id: null })}
        style={{ position: 'relative' }}
      >
        <i className="fa fa-pencil text-inverse m-r-10 fa-2x">
          <FaPencilAlt
            style={{
              width: 24,
              height: 28,
              color: '#fb9678',
              cursor: 'pointer',
            }}
            onClick={() => {
              editToggle();
              getSupervisorTypeDetails(data?.id);
            }}
          />
          {/* Tooltip for Edit */}
          {hoveredAction.action === 'edit' && hoveredAction.id === data?.id && (
            <span
              style={{
                position: 'absolute',
                bottom: '125%',
                left: '50%',
                transform: 'translateX(-50%)',
                backgroundColor: 'black',
                color: 'white',
                textAlign: 'center',
                padding: '7px',
                borderRadius: '5px',
                zIndex: 1,
                whiteSpace: 'nowrap',
                fontSize: '12px',
                fontFamily: 'Poppins',
              }}
            >
              Edit
              <span
                style={{
                  position: 'absolute',
                  top: '100%',
                  left: '50%',
                  transform: 'translateX(-50%)',
                  borderWidth: '5px',
                  borderStyle: 'solid',
                  borderColor: 'black transparent transparent transparent',
                }}
              ></span>
            </span>
          )}
        </i>
      </a>
      <a
        data-toggle="tooltip"
        data-original-title="Delete"
        onMouseEnter={() =>
          setHoveredAction({ action: 'delete', id: data?.id })
        }
        onMouseLeave={() => setHoveredAction({ action: '', id: null })}
        style={{ position: 'relative' }}
      >
        <i className="fa fa-close text-danger  fa-2x">
          <ImCross
            style={{
              color: '#e36d6d',
              width: 22,
              height: 20,
              cursor: 'pointer',
            }}
            onClick={() => {
              const confirmed = window.confirm(
                'Are you sure you want to delete this item?',
              );
              if (confirmed) {
                handleDelete(data?.id);
              }
            }}
          />
          {/* Tooltip for Delete */}
          {hoveredAction.action === 'delete' &&
            hoveredAction.id === data?.id && (
              <span
                style={{
                  position: 'absolute',
                  bottom: '125%',
                  left: '50%',
                  transform: 'translateX(-50%)',
                  backgroundColor: 'black',
                  color: 'white',
                  textAlign: 'center',
                  padding: '7px',
                  borderRadius: '5px',
                  zIndex: 1,
                  whiteSpace: 'nowrap',
                  fontSize: '12px',
                  fontFamily: 'Poppins',
                }}
              >
                Delete
                <span
                  style={{
                    position: 'absolute',
                    top: '100%',
                    left: '50%',
                    transform: 'translateX(-50%)',
                    borderWidth: '5px',
                    borderStyle: 'solid',
                    borderColor: 'black transparent transparent transparent',
                  }}
                ></span>
              </span>
            )}
        </i>
      </a>
    </div>;
    },
})
i have this code and the problem is that things are working fine when viewing a table and doing CRUD operations on it. but problem appears when i click on print option. the tables appears as below in the print:
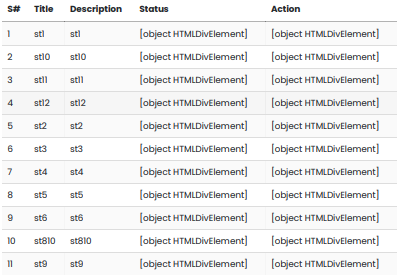
how do i show the actual HTML content instead of [object HTMLDivElement] while printing?
↧
↧
Join with table rename
Link to test case: https://editor.datatables.net/examples/advanced/joinArray
Description:
It would be interesting to be able to change the name of the linked table. Like: "Mjoin::inst( 'permission as permission' )" .
This might be useful in some circumstances....
↧
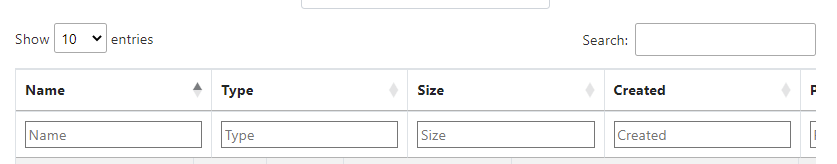
Position and dimension of the search box
Hi,
I would like to know if I can enlarge the text box search and move it
↧
Comments cannot be added to 'Installation' page
https://datatables.net/manual/installation**:
**Debugger code (debug.datatables.net):
Sorry - an error has occurred. Please try again in a few minutes:
Created forum account. Tried to add comment to 'Installation' page. Error repeats no matter how long I wait.:
↧
unable to fire the function or show the icon from the fontawesome although the library is imported
data() {
        return {
            columns: [
                {data: 'name'},
                {
                    data: null,
                    orderable: false,
                    render: (data) => {
                        return `<button type="button" @click.prevent="startUpdating(${data})">
                                          <font-awesome-icon icon="pen-to-square" style="color: orange" size="xl" data-toggle="tooltip" />
                                    </button>`;
                    }
                },
            ]
        }
    },
↧
↧
Pagination show only one page button
Link to test case:
Debugger code (debug.datatables.net):
Error messages shown: no error message
Description of problem:
I try use datatables 2.18, and datatable-bootstrap5
I use serverSide.
Its response from the backend:
{
    "draw": "1",
    "recordsTotal": 12,
    "recordsFiltered": 10,
    "data": [
        {
            "id": 1,
            "username": "Admin",
            "email": "admin@example.com"
        },
        {
            "id": 2,
            "username": "AdminBankMaju",
            "email": "admin-bank-maju@example.com"
        },
        {
            "id": 3,
            "username": "AdminMekar",
            "email": "admin-bank-mekar@example.com"
        },
        {
            "id": 4,
            "username": "Marketing",
            "email": "marketing@example.com"
        },
        {
            "id": 5,
            "username": "MarketingJuga",
            "email": "marketing.juga@example.com"
        },
        {
            "id": 6,
            "username": "MarketingLagi",
            "email": "marketing.lagi@example.com"
        },
        {
            "id": 7,
            "username": "User1",
            "email": "u1@example.com"
        },
        {
            "id": 8,
            "username": "user2",
            "email": "u2@example.com"
        },
        {
            "id": 9,
            "username": "user3",
            "email": "u3@example.com"
        },
        {
            "id": 10,
            "username": "user4",
            "email": "u4@example.com"
        }
    ],
    "tokenHash": "5e6d77ad43d44e4d7bf2e8959be29c5b"
}
this is the script
<script>
        'use strict';
        const baseUrl = document.querySelector('meta[name="base-url"]').content;
        const dt_ajax_src = $('#dt_ajax_src').val();
        const dt_user = $('#datatables-users').DataTable({
            processing: true,
            serverSide: true,
            ajax: {
                url: dt_ajax_src,
                type: "post",
                dataType: 'json',
                data: function(d) {
                    // -- definisi csrf harus disini
                    let csrfName = $('.ci_csrf_data').attr('name');
                    let csrfHash = $('.ci_csrf_data').val();
                    let csrf = {}
                    csrf[csrfName] = csrfHash;
                    d = $.extend({}, d, csrf);
                    return $.extend({}, d, {
                        // filters: {
                        //     userRole: $('#userRole').val(),
                        // }
                    });
                    // kemudian update csrf token baru, bisa via ajax.dataSrC atau via datatables.drawCallback
                },
                dataSrc: function(res) {
                    // set csrf baru
                    $('.ci_csrf_data').val(res.tokenHash);
                    return res.data;
                }
            },
            pagingType: "full_numbers",
            // lengthMenu: [2, 5, 10, 25, 50, 75, 100],
            columns: [
                // columns according to JSON
                {
                    data: 'id'
                },
                {
                    data: 'username'
                },
                {
                    data: 'email'
                }
            ],
        });
    </script>
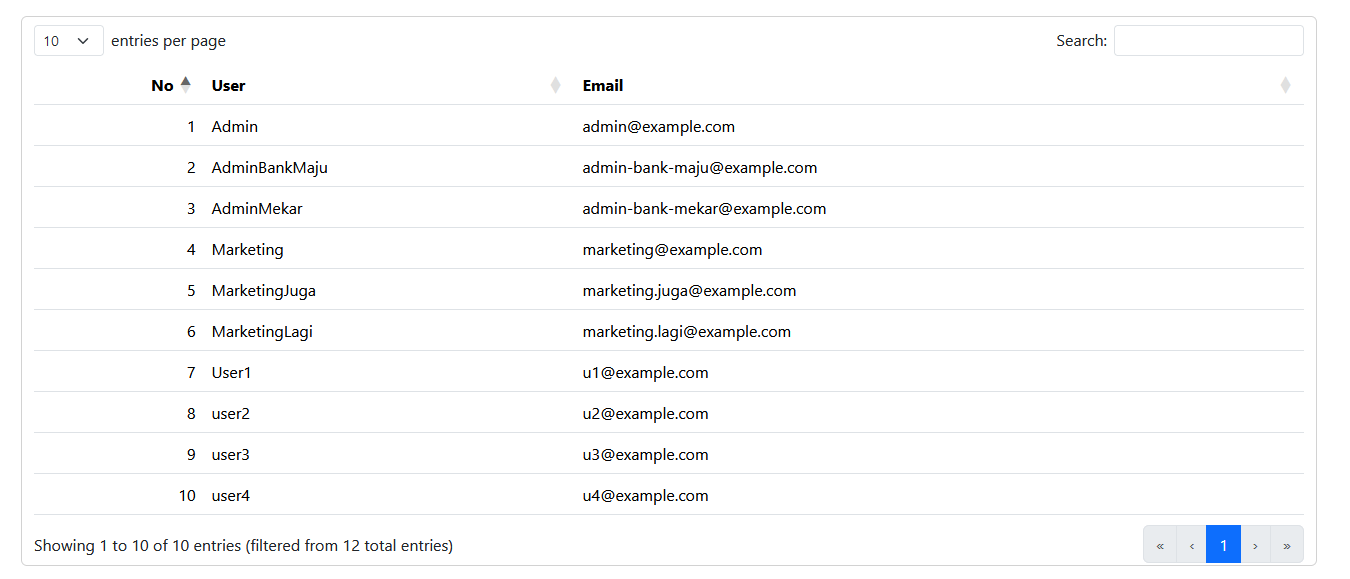
Its only 1 button at pagination. it should 2 page.
button first, prev, next, and last can't clicked.
↧
Adding href parameter for the pagination links
Link to test case: https://www.silabs.com/support/resources.ct-data-sheets.page=2
Description of problem: We are using DataTable with pagination as given in the URL above. During our Google SEO analysis we found the pagination links are missing href pointing to a page and google cant crawl the pages going into the pagination links. So the google search is not indexing/serving the pages/documents in their search results from those pagination links.
Could anyone please advice on how to add href to the pagination links since its auto generated by the plugin instead of like
<a class="paginate_button " aria-controls="DataTables_Table_0" data-dt-idx="1" tabindex="0">1</a>. Any help is appreciated. Thanks
↧
colspan not working with single head row
According to https://datatables.net/examples/basic_init/complex_header, colspan is fully support in header rows.
This is working well in that example, obviously, where the header has multiple rows.
However, if a <thead> only has a single <tr> with cells that use colspan, a JavaScript error is raised.
Here is a test case with a single header row and one colspanned cell in it:
https://live.datatables.net/nipufeda/1/
However, when duplicating the row (I prepared that as a HTML comment in the test case), everything works fine again.
↧
While in print view, the old datatable is seen, not the updated one?
Description of problem:
Generic Datatable component code:
import React, { useEffect, useRef, useState } from 'react';
import $ from 'jquery';
// import 'bootstrap/dist/css/bootstrap.min.css';
import 'jquery/dist/jquery.min';
import "datatables.net-dt/js/dataTables.dataTables";
import "datatables.net-dt/css/dataTables.dataTables.min.css";
import "datatables.net-buttons/js/buttons.colVis";
import "datatables.net-buttons/js/buttons.html5";
import "datatables.net-buttons/js/buttons.print";
import "datatables.net-buttons/js/dataTables.buttons";
// import 'jszip';
import JSZip from 'jszip';
import 'pdfmake';
// import 'pdfmake/build/pdfmake';
// import 'pdfmake/build/vfs_fonts';
import pdfMake from "pdfmake/build/pdfmake";
import pdfFonts from "pdfmake/build/vfs_fonts";
import DataTable from 'datatables.net-buttons-dt';
import JsPDF from "jspdf";
import html2canvas from "html2canvas-pro";
import * as html2pdf from 'html2pdf.js'

window.JSZip = JSZip;
pdfMake.vfs = pdfFonts.pdfMake.vfs;


const MasterDataTable = (prop) => {
  const { tableId, tableData } = prop
  const dataTableRef = useRef(null);

  useEffect(() => {

        // if ($.fn.DataTable.isDataTable(`#${tableId}`)) {
          // $(`#${tableId}`).DataTable().destroy();
          // console.log("destroyed")
        // }
        // if ($.fn.DataTable.isDataTable(`#${tableId}`)) {
          // $(`#${tableId}`).DataTable().destroy();
          // console.log("destroyed2")
        // }
        // if (dataTableRef.current) {
          // dataTableRef.current.destroy();
          // dataTableRef.current = null
          // dataTableRef.current
          // .rows()
          // .invalidate()
          // .draw();
        // }
        // if ($.fn.DataTable.isDataTable(`#${tableId}`)) {
        //   $(`#${tableId}`).DataTable().destroy(true);//.clear().draw(false)
        //   console.log(`DataTable with ID #${tableId} destroyed.`);
        // }
        // if ($.fn.DataTable.isDataTable(`#${tableId}`)) {
        //   $(`#${tableId}`).DataTable().clear().draw(); // Only clear and redraw instead of destroy
        //   console.log(`DataTable with ID #${tableId} cleared.`);
        // }
        // if ($.fn.DataTable.isDataTable(`#${tableId}`)) {
        //   dataTableRef.current.fnDestroy();
        // // $(`#${tableId}`).DataTable().clear().draw();
        // // $(`#${tableId}`).DataTable().destroy();
        // }
        if(tableData?.length > 0){
          // const dt =
        dataTableRef.current =  new DataTable(`#${tableId}`, {
        // $(`#${tableId}`).DataTable({
            // pagingType: 'full_numbers',
            // pageLength: 10,
            paging: false,
            info: false,
            processing: true,
            responsive: true,
            // destroy: true,
            retrieve: true,
            dom: 'Bfrtip',
            // buttons: ['copyHtml5', 'csvHtml5', 'excelHtml5', 'pdfHtml5', 'print'],
            orientation: tableData[0] && tableData[0].length > 4 ? 'landscape' : 'portrait', // Set orientation based on column count
            pageSize: tableData[0] && tableData[0].length > 4 ? 'A3' : 'A4', // Adjust page size based on the number of columns
            buttons: [
                // {
                //     extend: 'copyHtml5',
                //     exportOptions: {
                //       columns: ':visible',
                //       modifier: {
                //         page: 'all'
                //       },
                //       format: {
                //           body: (data, row, column, node) => {
                //           // Dynamically handle the Status column
                //               if ($(node).closest('td').hasClass('status-column')) {
                //               return $(data).find('input').is(':checked') ? 'True' : 'False';
                //               }
                //               return $(node).text().trim();
                //           }
                //       },
                //       stripHtml: true,
                //     },
                // },
                {
                extend: 'csvHtml5',
                exportOptions: {
                    columns: ':visible',
                    modifier: {
                    page: 'all'
                    },
                    format: {
                      body: (data, row, column, node) => {
                      // Dynamically handle the Status column
                        if ($(node).closest('td').hasClass('status-column')) {
                        return $(data).find('input').is(':checked') ? 'True' : 'False';
                        }
                        return $(node).text().trim();
                      }
                    },
                    stripHtml: true,
                }
                },
                // {
                //   extend: 'excelHtml5',
                //   exportOptions: {
                //     columns: ':visible',
                //     modifier: {
                //       page: 'all'
                //     },
                //     format: {
                //       body: (data, row, column, node) => {
                //       // Dynamically handle the Status column
                //         if ($(node).closest('td').hasClass('status-column')) {
                //         return $(data).find('input').is(':checked') ? 'True' : 'False';
                //         }
                //         return $(node).text().trim();
                //       }
                //     },
                //     stripHtml: true,
                //   }
                // },
                {
                  extend: 'pdf',
                  exportOptions: {
                    columns: ':visible',
                    stripHtml: false,
                    modifier: {
                      page: 'all'
                    }
                  },
                  action: ( e, dt, button, config ) => {
                    // const table = dt.table().node(); // Get table node

                    // // Use html2canvas and jsPDF to create the PDF
                    // html2canvas(table, {
                    //     scale: 2, // Higher scale increases resolution
                    //     allowTaint:true,
                    //     useCORS: true,
                    // }).then((canvas) => {
                    //     const pdf = new JsPDF('p', 'mm', 'a4'); // Portrait orientation
                    //     const imgData = canvas.toDataURL('image/png');
                    //     const pdfWidth = pdf.internal.pageSize.getWidth();
                    //     const pdfHeight = (canvas.height * pdfWidth) / canvas.width;

                    //     pdf.addImage(imgData, 'PNG', 0, 0, pdfWidth, pdfHeight);
                    //     pdf.save('table.pdf'); // Saves the PDF with the specified name
                    // });

                    const table = document.getElementById(tableId)

                    const opt = {
                      margin: [15,15],
                      filename: 'table.pdf',
                      image:        { type: 'jpeg', quality: 0.98 },
                      html2canvas:  { scale: 2, letterRendering: true },
                      jsPDF:        { unit: 'pt', format: 'letter', orientation: 'portrait' },
                     pagebreak: { mode: ['avoid-all', 'css', 'legacy'] }
                   };
                    html2pdf().from(table).set(opt).save()
                  }
                },
                {
                    extend: 'print',
                    exportOptions: {
                      columns: ':visible',
                      stripHtml: false,
                      modifier: {
                        page: 'all'
                      }
                    }
                  },
                'colvis',

              ],
              initComplete: ()=> {
                // $(`#${tableId}`).addClass('table table-bordered table-hover toggle-circle custom-table table');
            }
            });
            console.log(`DataTable with ID #${tableId} initialized.`);
            // if (dataTableRef.current) {
            //   console.log(2)
            //   dataTableRef.current.clear()//.destroy(true);
            //   dataTableRef.current = null;
            // }
        // Cleanup function to destroy the DataTable when component unmounts
        // return () => {
        // $(`#${tableId}`).DataTable().destroy(true);
        // console.log(`DataTable with ID #${tableId} cleaned up on unmount.1`);
        // };
    }
    // return () => {
    //   if ($.fn.DataTable.isDataTable(`#${tableId}`)) {
    //     $(`#${tableId}`).DataTable().clear().draw(false);
    //     console.log(`DataTable with ID #${tableId} cleaned up on unmount.2`);
    //   }
    // };
    // return null
    // if ($.fn.DataTable.isDataTable(`#${tableId}`)) {
    //   $(`#${tableId}`).DataTable().destroy(false);
    // }

  }, [tableId, tableData]);


//   return null; // No need to render anything
};

export default MasterDataTable;
Problem is that when i add an item to the datatable, and then print, then the added item is not seen in the table in print. and if i delete an item from the table then it disappears. But in the print view, the item can still be seen. To simplify, the print view is not showing the updated datatable but an old one. Ofcourse when i refresh the page then everything works fine but that is not a solution. any help would be much appreciated. Thanks in advance.
↧
↧
Bug Report for searchBuilder: Rendering Arrays
Link to test case: https://datatables.net/extensions/searchbuilder/examples/customisation/renderArrays.html
Debugger code (debug.datatables.net):
Error messages shown: None
Description of problem: searchBuilder for arrays returns no results when using Equals condition
To reproduce in the example on that page:
1. Click Add Condition
2. Select Permissions from Data dropdown
3. Select Equals from condition dropdown
4. Select Any value from Value dropdown
5. 5. Observe that no results are returned
↧
Processing indicator not showing after ajax.reload()
Is it normal behavior for the processing indicator, not appearing on ajax.reload if there are more than 25 entries?
In my particular case it doesn't appear if the page length is more than 25.
Even if I set paging to false.
Before posting the code and set an example, there's something else I can try? or is this a common behavior?
↧
Processing Spinner to appear with a deferred ajax loading
I've this case, I create the Table structure in the file, with the configuration options and the column definitions. Then I load the rows with a JS function, in a success after ajax call
table.clear().rows.add(response.data).draw();
where response.data is the JSON returned from the Ajax, with all the info
Is there a way to have the processing spinner appear from when the ajax call start till I redraw the table?
↧